Fig. 6
Download original image
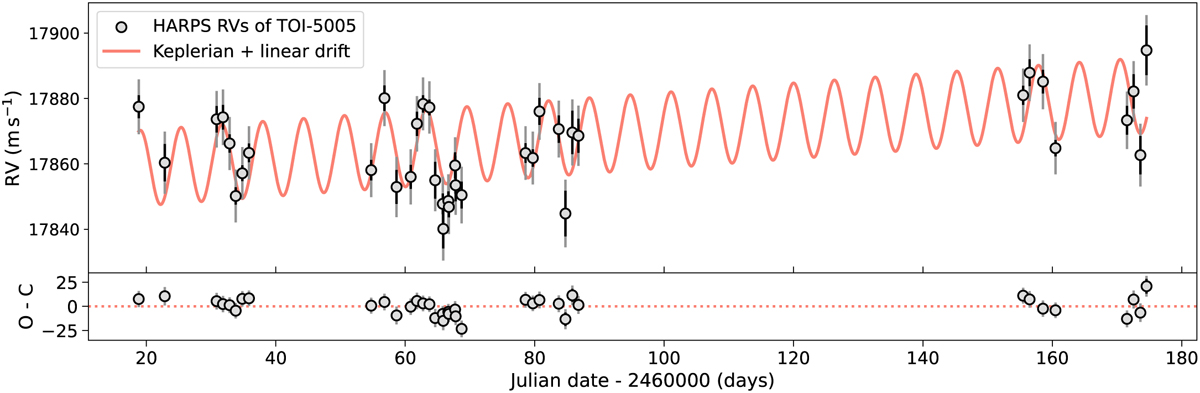
HARPS radial velocities of TOI-5005. The red solid line indicates the simplest model that best represents our data (i.e. a Keplerian model plus a linear drift; 1p1cL), selected based on our joint analysis of the HARPS and TESS datasets (Sect. 4.4). The black error bars represent the uncertainties as estimated by the HARPS DRS (σi,HARPS ; Sect. 2.4), and the grey error bars represent the total uncertainties computed as ![]() , where σjit,harps is the posterior median jitter term.
, where σjit,harps is the posterior median jitter term.
Current usage metrics show cumulative count of Article Views (full-text article views including HTML views, PDF and ePub downloads, according to the available data) and Abstracts Views on Vision4Press platform.
Data correspond to usage on the plateform after 2015. The current usage metrics is available 48-96 hours after online publication and is updated daily on week days.
Initial download of the metrics may take a while.