Fig. A.3
Download original image
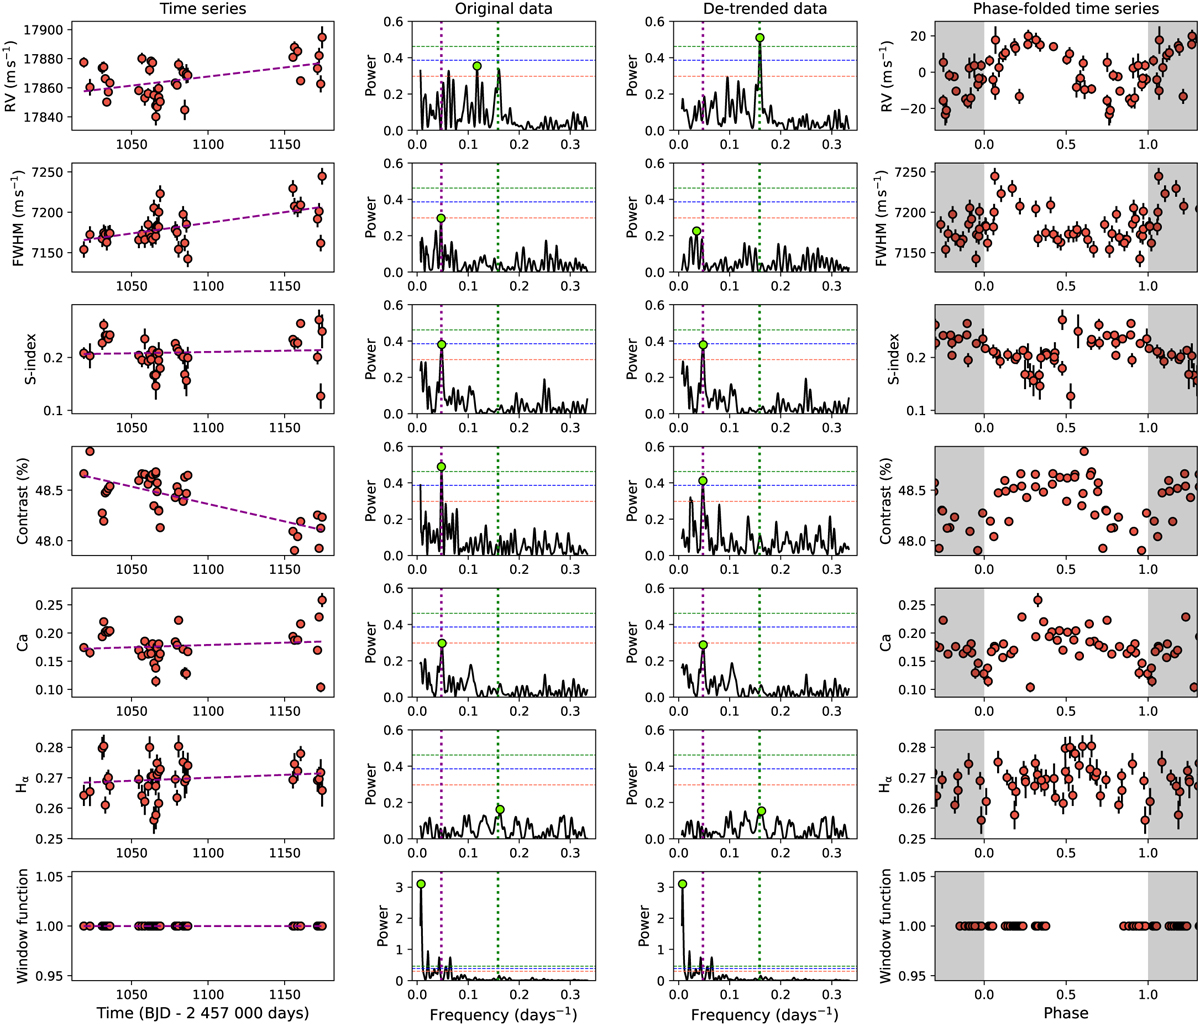
Sinusoidal signals within the HARPS RVs of TOI-5005. Left panels: Time series of the HARPS RVs, activity indicators, and the window function. The magenta dashed lines represent the linear trends fit to the data. Centre panels: GLS periodograms of the original time series and de-trended time series. The green dotted vertical lines indicate the location of the orbital period of TOI-5005.01 (Рогb = 6.3 days). The magenta dotted vertical lines indicate the ≃2l-day activity-related signal that most likely reflects the stellar rotation period. The horizontal dotted lines correspond to the 10 (orange), 1 (blue), and 0.1% (green) FAP levels. Right panels: HARPS data folded to the maximum power periods: 6.3 days (RVs), 21.3 days (FWHM), 20.8 days (S-index), 21.0 days (Contrast), 20.5 days (Ca), 6.2 days (HJ, and 129.8 days (window function). The RV panel shows the de-trended data and the indicators panels show the original time series.
Current usage metrics show cumulative count of Article Views (full-text article views including HTML views, PDF and ePub downloads, according to the available data) and Abstracts Views on Vision4Press platform.
Data correspond to usage on the plateform after 2015. The current usage metrics is available 48-96 hours after online publication and is updated daily on week days.
Initial download of the metrics may take a while.