Fig. A.2
Download original image
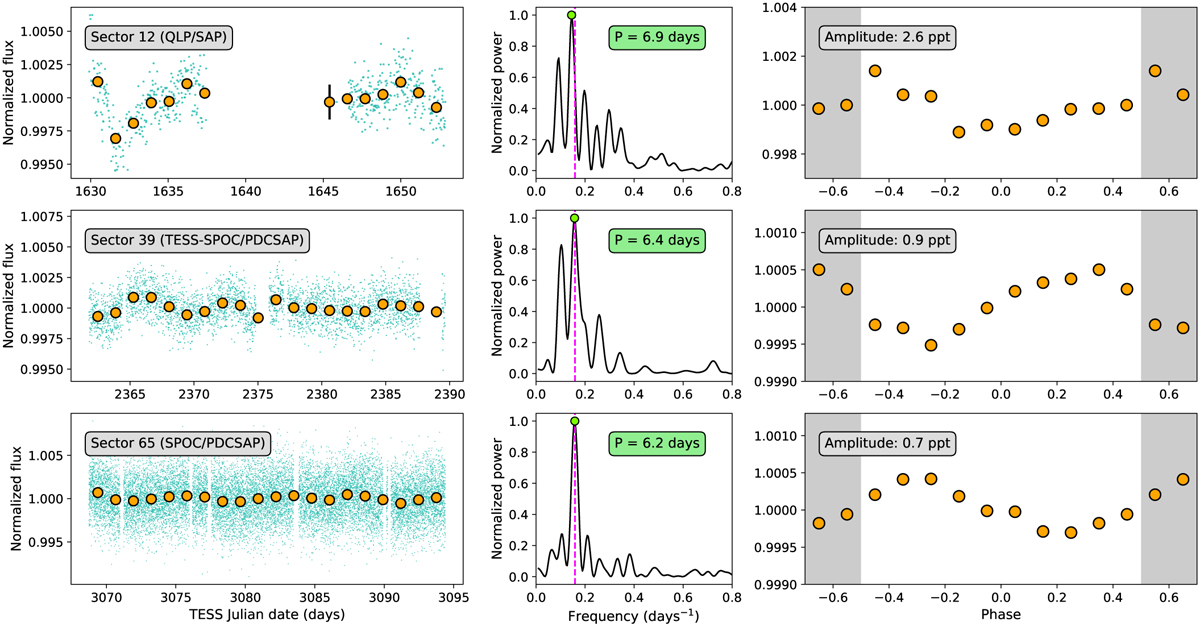
Sinusoidal signals within the TESS photometry of TOI-5005. Left panels: Photometric time series without the TOI-5005.01 transits. The orange circles correspond to 1.3-day binned data. Centre panels: Generalized Lomb-Scargle Periodograms of the time series. The vertical magenta dashed lines indicate the orbital period of TOI-5005.01. The green circles and boxes indicate the maximum power frequencies. Right panels: Photometric time series folded to the orbital period of TOI-5005.01. The phase is referred to the time of inferior conjunction. The orange circles correspond to data binned over phase windows of 0.1 in width.
Current usage metrics show cumulative count of Article Views (full-text article views including HTML views, PDF and ePub downloads, according to the available data) and Abstracts Views on Vision4Press platform.
Data correspond to usage on the plateform after 2015. The current usage metrics is available 48-96 hours after online publication and is updated daily on week days.
Initial download of the metrics may take a while.