Fig. A.1
Download original image
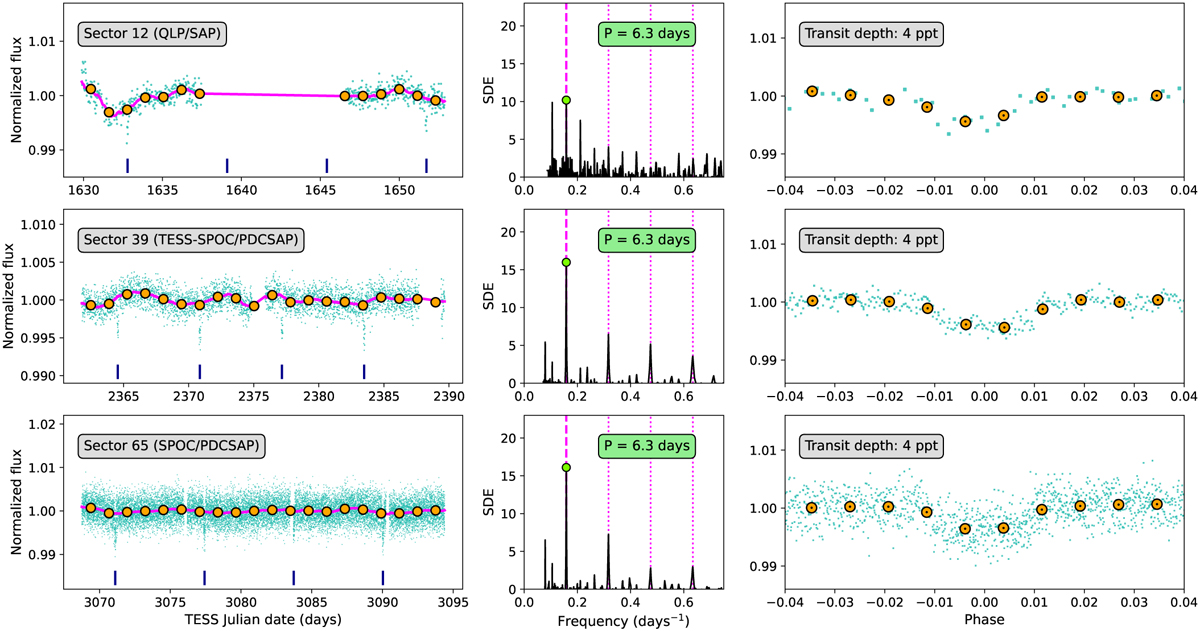
Transit-like signals within the TESS photometry of TOI-5005. Left panels: Photometric time series. The magenta line is the trend used to flatten the photometry before the periodogram computation, which was obtained through the time-windowed biweight method implemented in wotan (Hippke et al. 2019) with a 1-day window length. The orange circles correspond to 1.3-day binned data. Centre panels: Transit least squares periodograms of the corresponding time series. The vertical magenta dashed lines indicate the orbital period of TOI-5005.01, and the vertical magenta dotted lines indicate its second, third, and fourth harmonics. Right panels: Flattened time series folded to the maximum power periods.
Current usage metrics show cumulative count of Article Views (full-text article views including HTML views, PDF and ePub downloads, according to the available data) and Abstracts Views on Vision4Press platform.
Data correspond to usage on the plateform after 2015. The current usage metrics is available 48-96 hours after online publication and is updated daily on week days.
Initial download of the metrics may take a while.