Fig. 12
Download original image
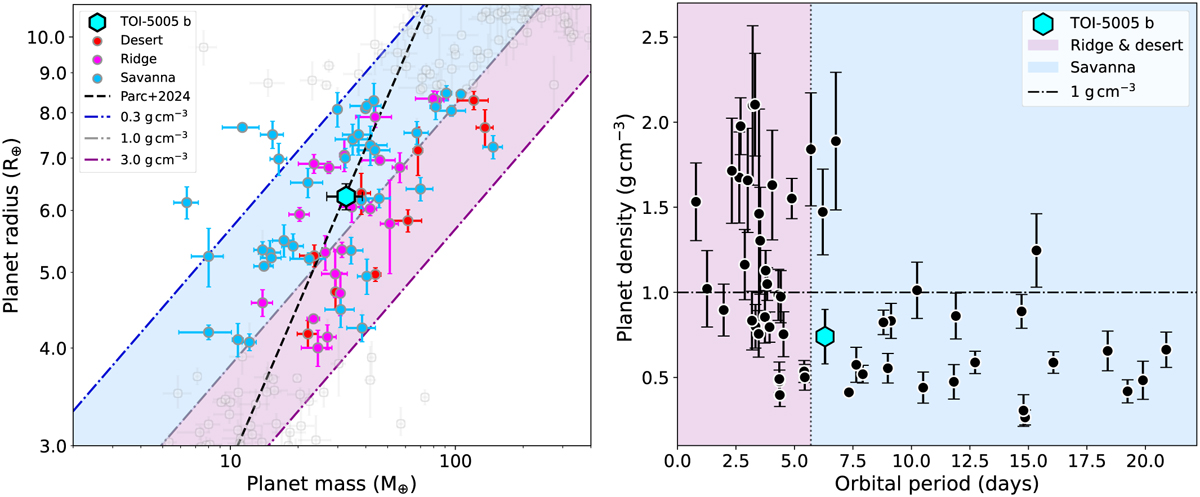
TOI-5005 b in the mass-radius and density-period diagrams. Left: mass-radius diagram of all Neptunian planets with masses and radii with precisions better than 20%. Right: density-period diagram of the same sample. The data were collected from the NASA Exoplanet Archive on 20/09/2024. This plot was generated with mr-plotter (https://github.com/castro-gzlz/mr-plotter; Castro-González et al. 2023).
Current usage metrics show cumulative count of Article Views (full-text article views including HTML views, PDF and ePub downloads, according to the available data) and Abstracts Views on Vision4Press platform.
Data correspond to usage on the plateform after 2015. The current usage metrics is available 48-96 hours after online publication and is updated daily on week days.
Initial download of the metrics may take a while.