Fig. 10
Download original image
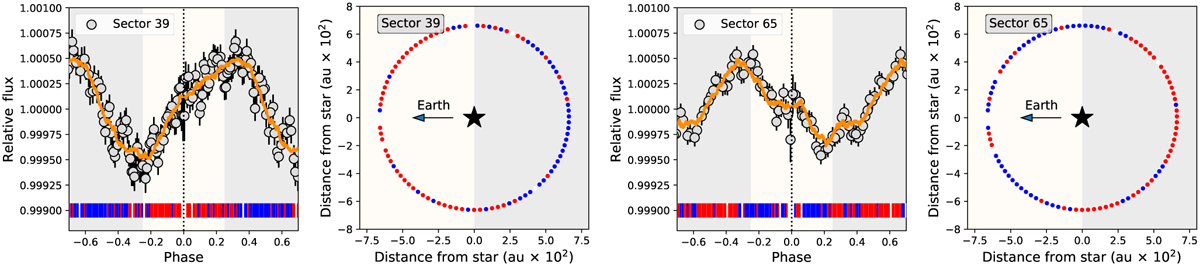
Links between the orbital motion of TOI-5005 b and the TESS photometric variability of TOI-5005. Left panels: TESS photometry of TOI-5005 folded in phase with the orbital period of TOI-5005 b (Sect. 4.4, Table D.6) and binned with ≃5% phase bins. The orange line corresponds to the filtered photometry through a median filter with a kernel size of 1401 cadences. The blue, red, and white vertical lines indicate whether the photometry increases, decreases, or remains stable in time lapses of ≃1.5 h. Right panels: orbital path of TOI-5005 b, which follows the anticlockwise direction. The circles represent the location of TOI-5005 b every ≃1.5 h and are coloured similarly to the vertical lines in the left panels. In all panels the white and grey backgrounds represent the orbital regions in which a hypothetical co-rotating active region would be visible and not visible from Earth, respectively.
Current usage metrics show cumulative count of Article Views (full-text article views including HTML views, PDF and ePub downloads, according to the available data) and Abstracts Views on Vision4Press platform.
Data correspond to usage on the plateform after 2015. The current usage metrics is available 48-96 hours after online publication and is updated daily on week days.
Initial download of the metrics may take a while.