Fig. 1
Download original image
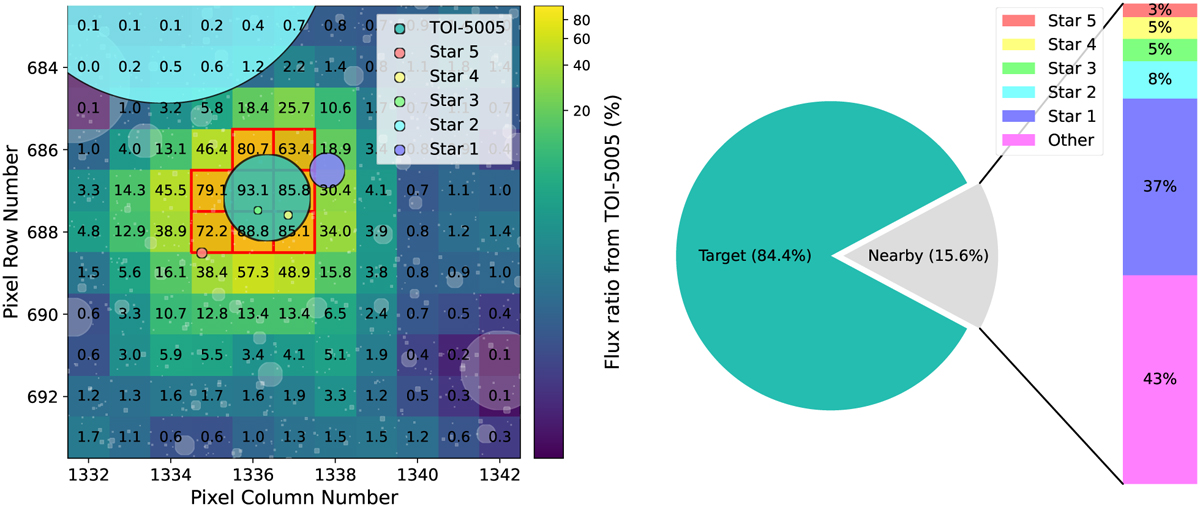
Nearby sources contaminating the TOI-5005 photometry. Left: TPF-shaped heatmap with the pixel-by-pixel flux fraction from TOI-5005 in S65. The red grid is the SPOC aperture. The pixel scale is 21 arcsec pixel−1. The white disks represent all the Gaia sources, and the five sources that most contribute to the aperture flux are highlighted in different colours. The disk areas scale with the emitted fluxes. Right: flux contributions to the SPOC aperture from the target and most contaminant stars. This plot was created through TESS-cont (https://github.com/castro-gzlz/TESS-cont).
Current usage metrics show cumulative count of Article Views (full-text article views including HTML views, PDF and ePub downloads, according to the available data) and Abstracts Views on Vision4Press platform.
Data correspond to usage on the plateform after 2015. The current usage metrics is available 48-96 hours after online publication and is updated daily on week days.
Initial download of the metrics may take a while.