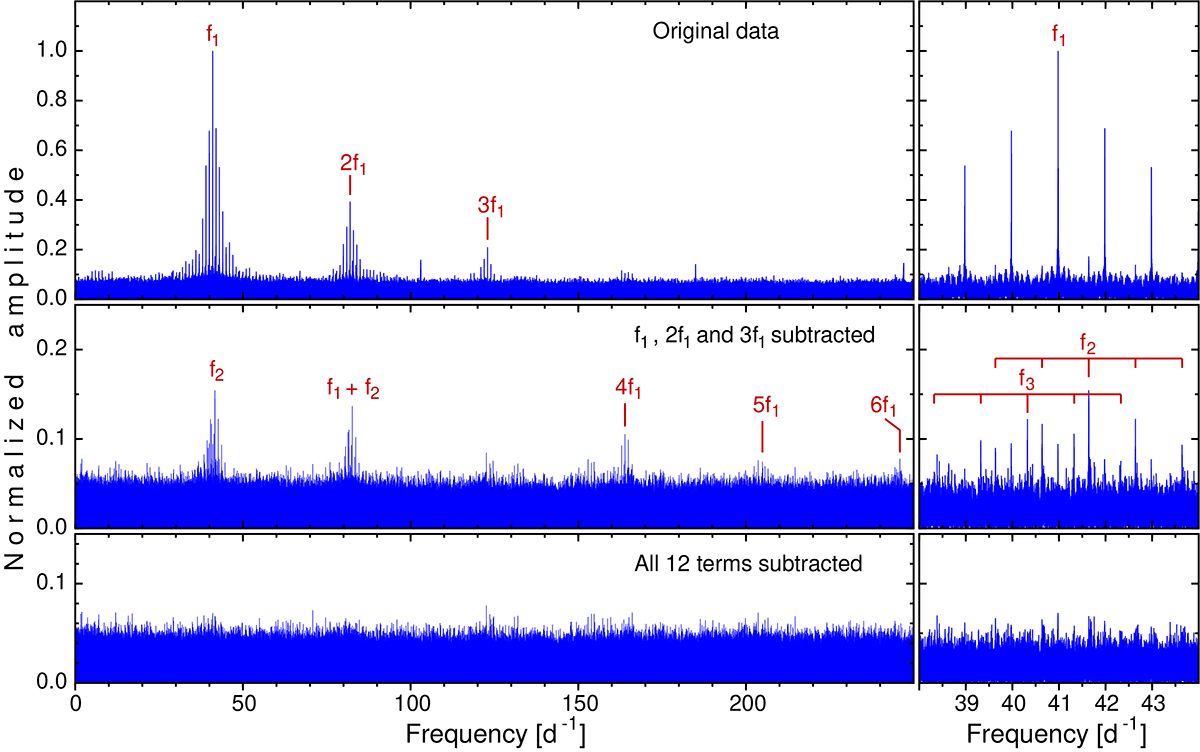
Fig. 8.
Download original image
Fourier frequency spectra of ZGP-BLAP-08 combined data at three steps of pre-whitening: for the original data (top panels), after subtracting the dominant term f1 and its two strongest harmonics (middle panels), and after subtracting all 12 terms (bottom panels). The left panels show spectra in the range of 0–250 d−1 and the right panels, zoomed parts of the frequency spectra close to the dominant term f1. The middle right panel shows the location of f2 and f3 and their nearest daily aliases, marked with tics.
Current usage metrics show cumulative count of Article Views (full-text article views including HTML views, PDF and ePub downloads, according to the available data) and Abstracts Views on Vision4Press platform.
Data correspond to usage on the plateform after 2015. The current usage metrics is available 48-96 hours after online publication and is updated daily on week days.
Initial download of the metrics may take a while.