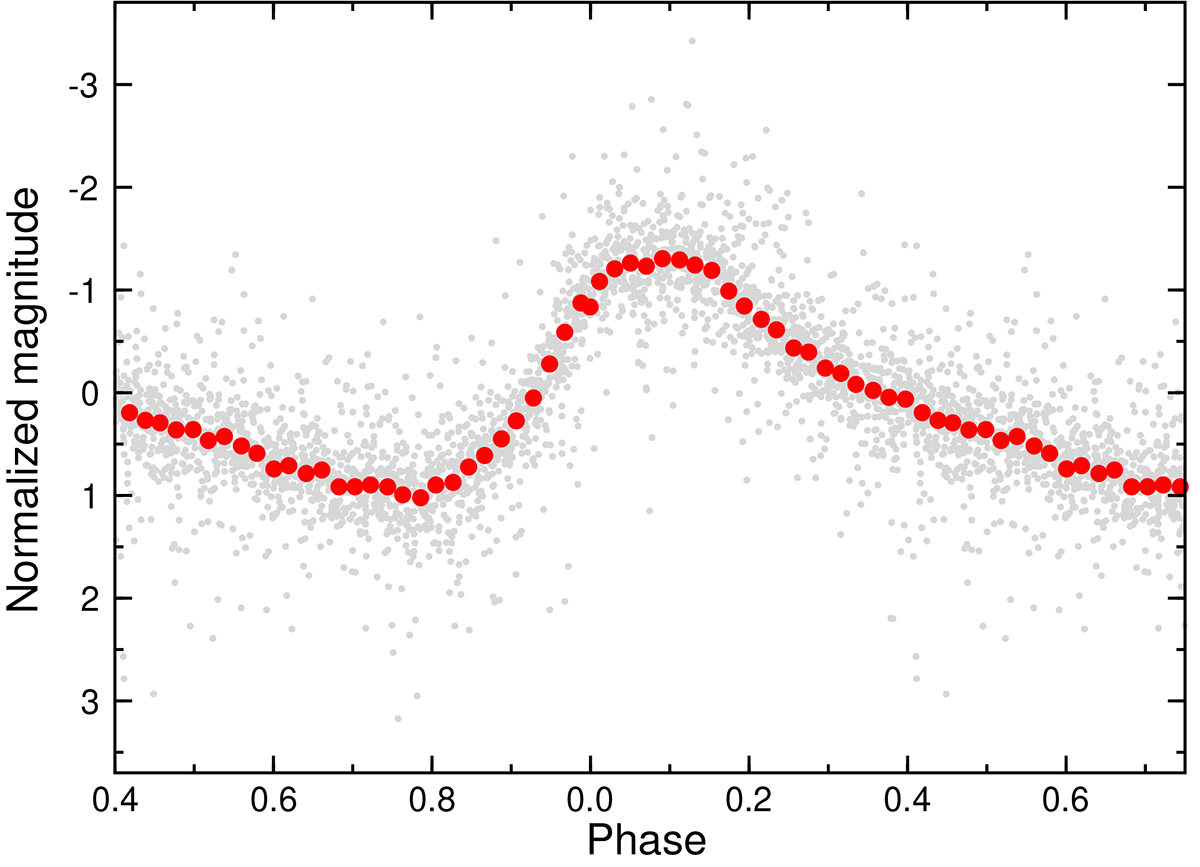
Fig. 5.
Download original image
Phased light curve for the dominant pulsation mode in OGLE-BLAP-001. The data were corrected for period changes, freed from the contribution of the terms other than f1 and its harmonics, and then combined and phased with the period of P1 = 1/f1 = 0.0196214703 d. Red dots stand for average values calculated in 0.02 phase intervals. Phase 0.0 corresponds to BJDTDB 2457000.0.
Current usage metrics show cumulative count of Article Views (full-text article views including HTML views, PDF and ePub downloads, according to the available data) and Abstracts Views on Vision4Press platform.
Data correspond to usage on the plateform after 2015. The current usage metrics is available 48-96 hours after online publication and is updated daily on week days.
Initial download of the metrics may take a while.