Fig. 3.
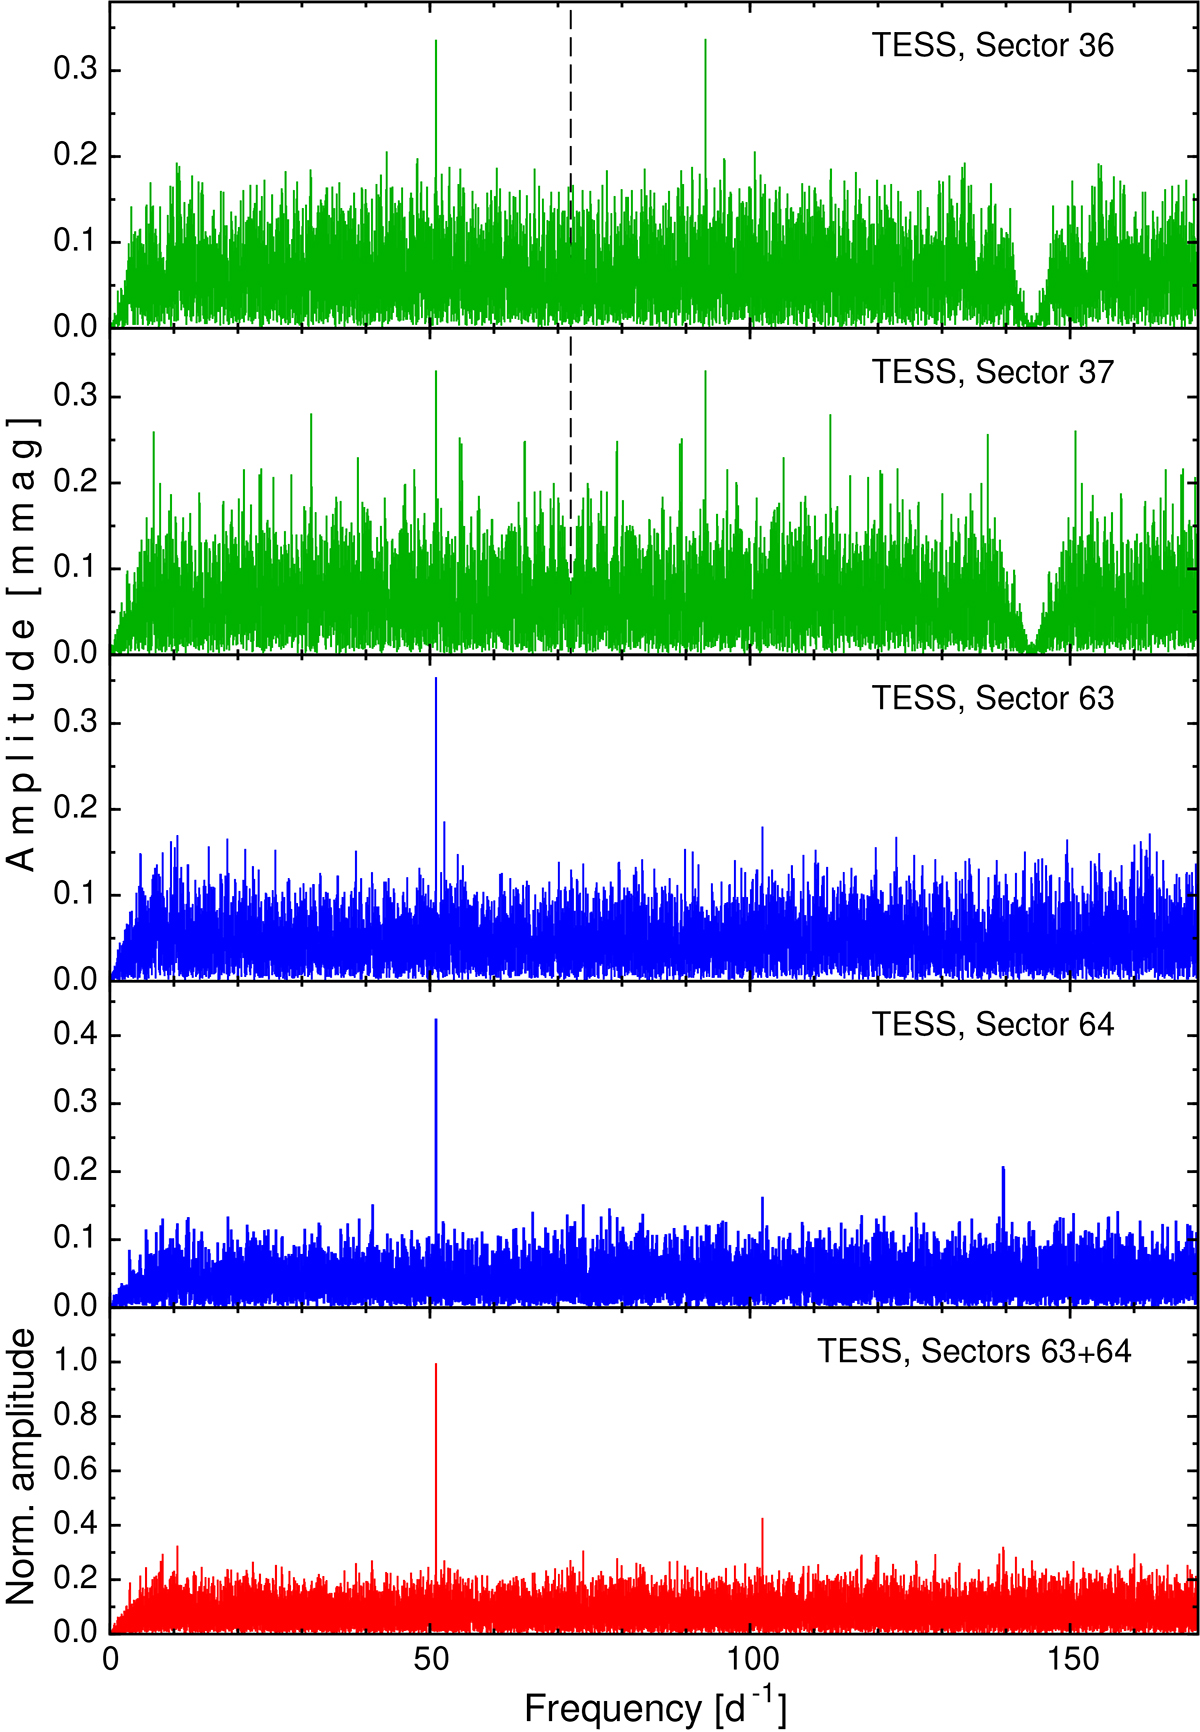
Download original image
Fourier frequency spectra for the pixel photometry of OGLE-BLAP-001 made using TESS FFIs in four sectors (labelled, four upper panels) observed with 10 min (Sectors 36 and 37) and 200 s (Sectors 63 and 64) cadences and for the combined Sector 63 and 64 data (the lower panel). Drops in signal at low frequencies are due to the strong detrending of the data. The drops are reproduced in the vicinity of the frequency of (10 min)−1 = 144 d−1 for the 10 min cadence data, twice the Nyquist frequency of 72 d−1, marked with the vertical dashed lines.
Current usage metrics show cumulative count of Article Views (full-text article views including HTML views, PDF and ePub downloads, according to the available data) and Abstracts Views on Vision4Press platform.
Data correspond to usage on the plateform after 2015. The current usage metrics is available 48-96 hours after online publication and is updated daily on week days.
Initial download of the metrics may take a while.