Fig. 10.
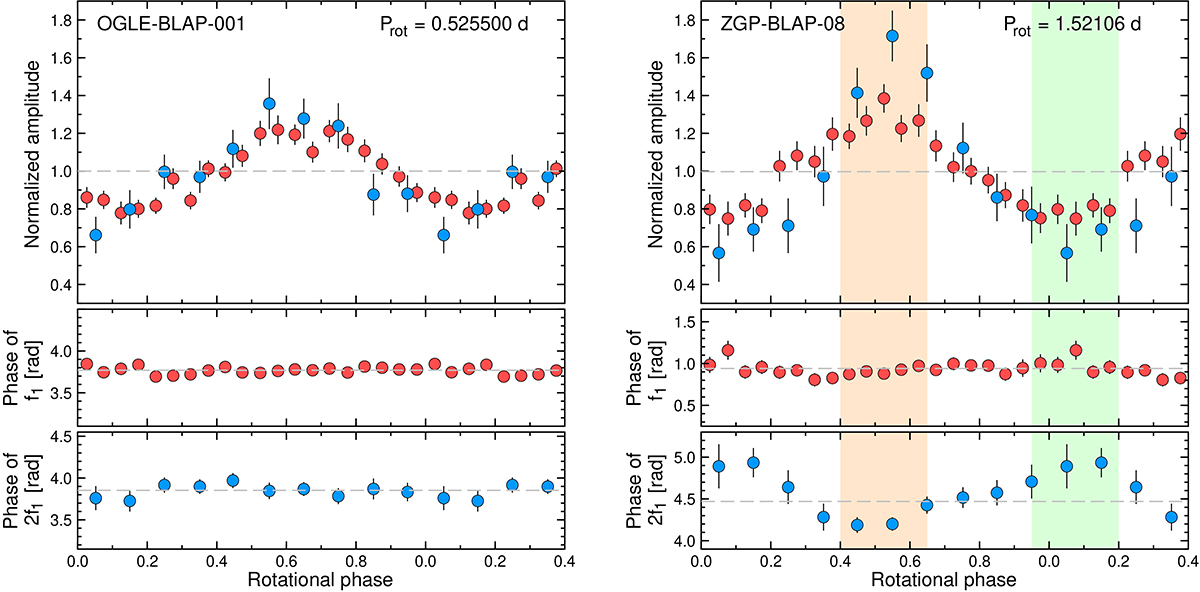
Download original image
Changes of pulsation amplitudes and phases as a function of rotational phase for OGLE-BLAP-001 and ZGP-BLAP-08. Top-left: Amplitudes of the f1 term (red) and 2f1 term (blue, normalised by its average amplitude, 0.376, Table 1) in the combined data of OGLE-BLAP-001 derived from data in 0.05 (f1) and 0.1 (2f1) phase intervals of the suspected rotational period of 0.525500 d. Rotational phase 0.0 corresponds to BJDTDB 2457000.0. Middle-left: Phases of the f1 term derived from the same data. Bottom-left: Phases of the 2f1 term derived from the same data. Top-right: Amplitudes of the f1 term (red) and 2f1 term (blue, normalised by its average amplitude, 0.385, Table 2) in the combined data of ZGP-BLAP-08 derived from data in 0.05 (f1) and 0.1 (2f1) phase intervals of the suspected rotational period of 1.52106 d. Rotational phase 0.0 corresponds to BJDTDB 2459200.0. Middle-right: Phases of the f1 term derived from the same data. Bottom-right: Phases of the 2f1 term derived from the same data. The orange and light-green strips for ZGP-BLAP-08 panels mark rotational phase intervals near the maximum and the minimum of pulsation amplitude, respectively, for which phased light curves are shown in Fig. 11. The dashed lines in all panels mark the average values of amplitudes and phases from Table 1 for OGLE-BLAP-001 and from Table 2 for ZGP-BLAP-08.
Current usage metrics show cumulative count of Article Views (full-text article views including HTML views, PDF and ePub downloads, according to the available data) and Abstracts Views on Vision4Press platform.
Data correspond to usage on the plateform after 2015. The current usage metrics is available 48-96 hours after online publication and is updated daily on week days.
Initial download of the metrics may take a while.