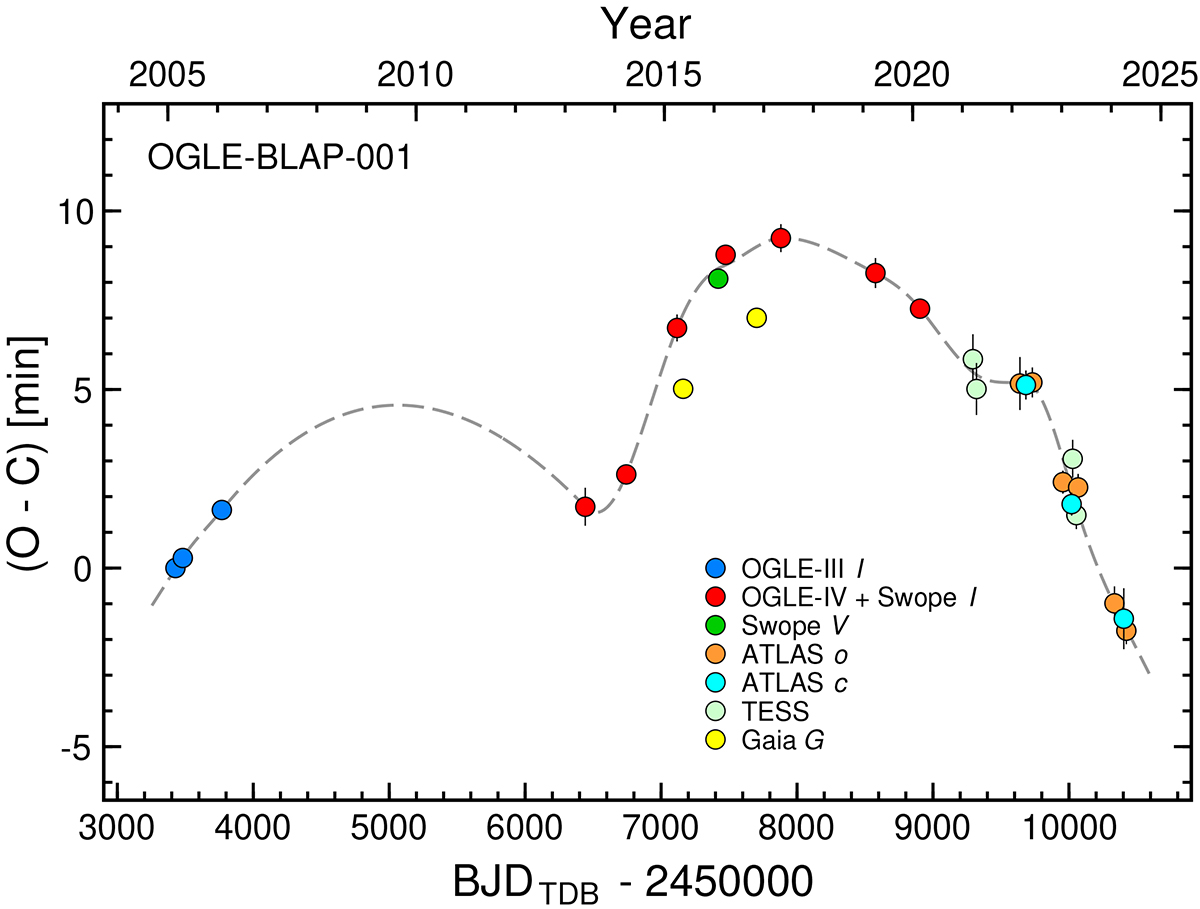
Fig. 1.
Download original image
O–C diagram for the dominant period of OGLE-BLAP-001 plotted as a function of time. The observed times of maximum light (O) and epochs E are given in Table A.1. The predicted times of maximum light (C) were calculated according to Eq. (1). The sources of data are labelled in the plot. The dashed line stands for smoothed changes, which were used to correct the times of observations for period changes, prior to the final analysis presented in Sect. 4.1.5.
Current usage metrics show cumulative count of Article Views (full-text article views including HTML views, PDF and ePub downloads, according to the available data) and Abstracts Views on Vision4Press platform.
Data correspond to usage on the plateform after 2015. The current usage metrics is available 48-96 hours after online publication and is updated daily on week days.
Initial download of the metrics may take a while.