Fig. 3.
Download original image
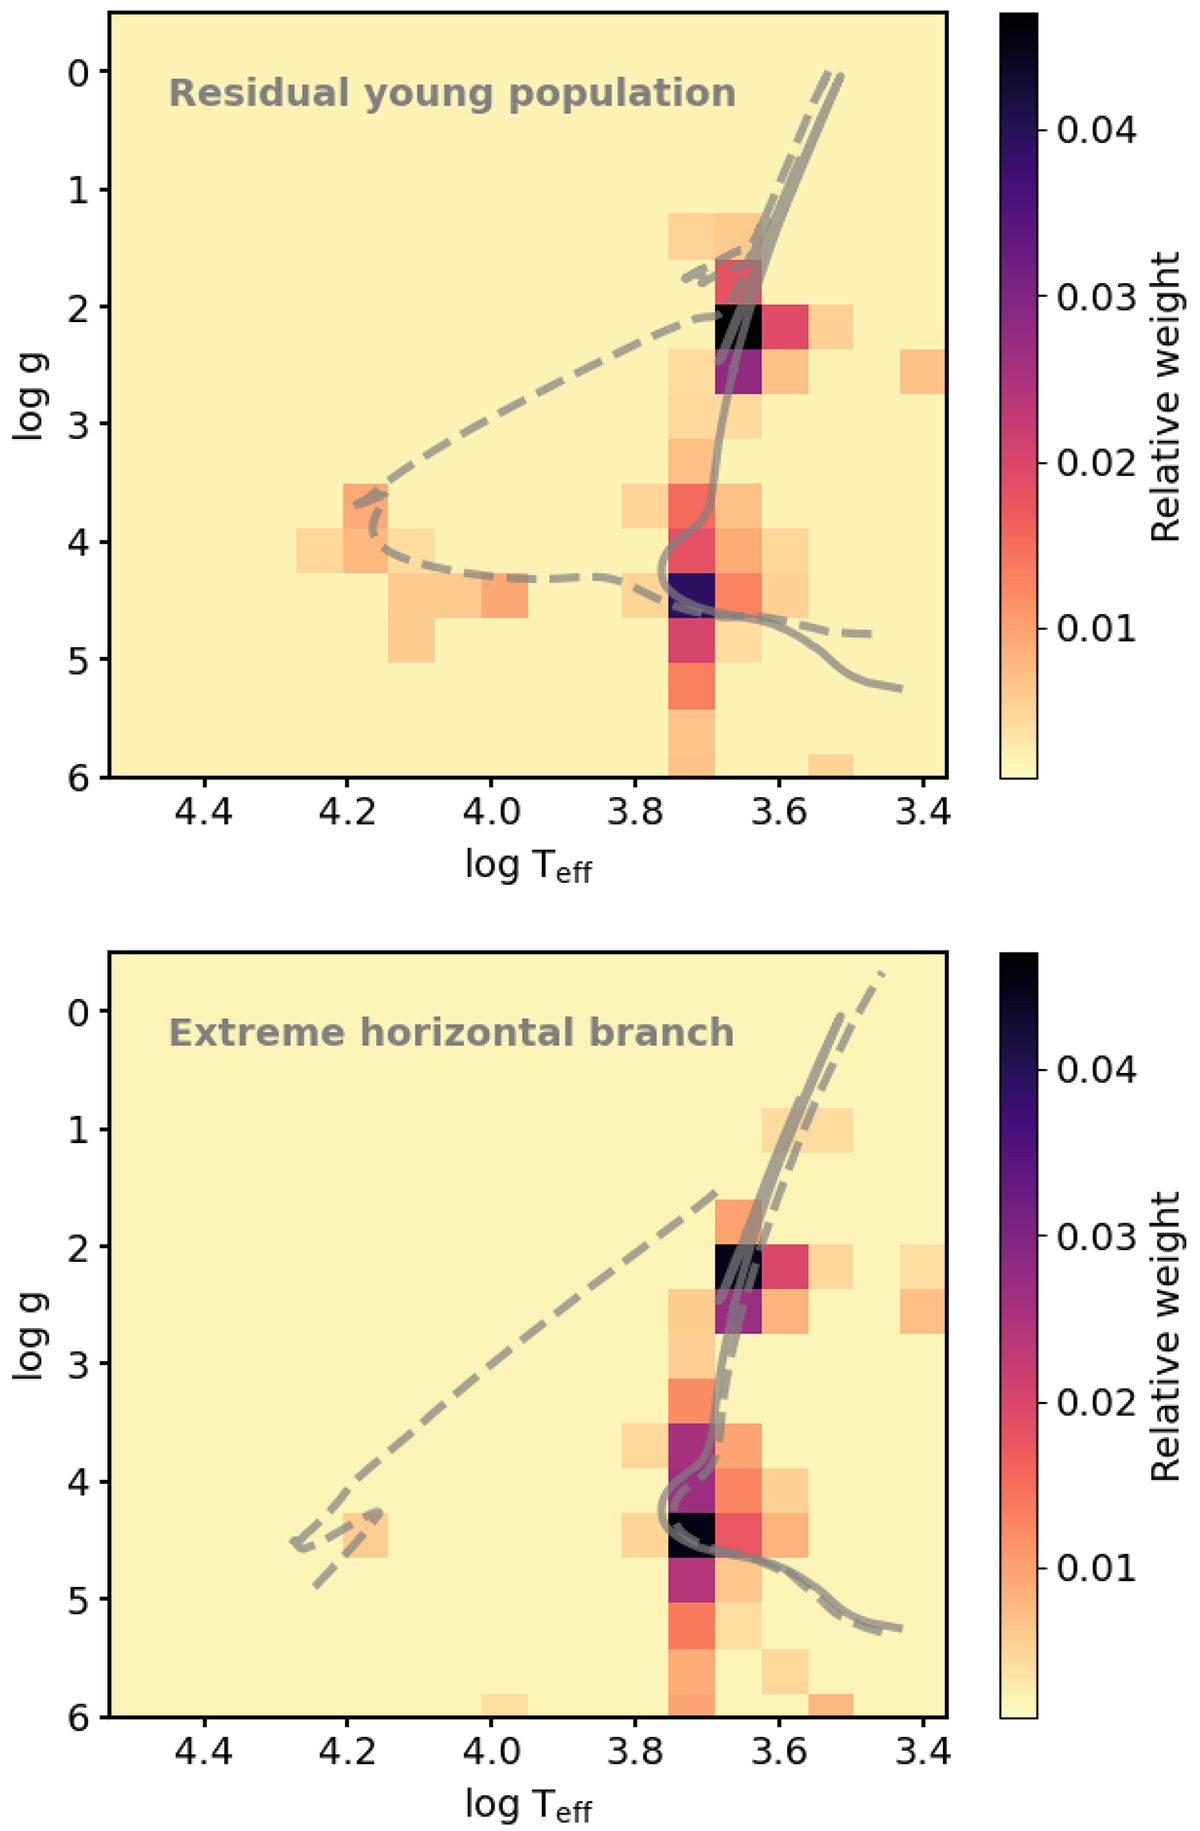
Young populations vs. extreme horizontal branch stars. Top: Weights distribution measured for a synthetic spectrum combining a dominant old population (13 Gyr) and a 0.5% contribution from an SSP with ∼0.1 Gyr. Solid and dashed gray lines indicate the isochrones of the old and young populations, respectively. The recovered weights follow the tracks defined by both isochrones. Bottom: Similar weights distribution but for the combination of the same old population plus 40% of an SSP with an extreme horizontal branch. Again, solid and dashed gray lines indicate the theoretical isochrones used to build the models.
Current usage metrics show cumulative count of Article Views (full-text article views including HTML views, PDF and ePub downloads, according to the available data) and Abstracts Views on Vision4Press platform.
Data correspond to usage on the plateform after 2015. The current usage metrics is available 48-96 hours after online publication and is updated daily on week days.
Initial download of the metrics may take a while.