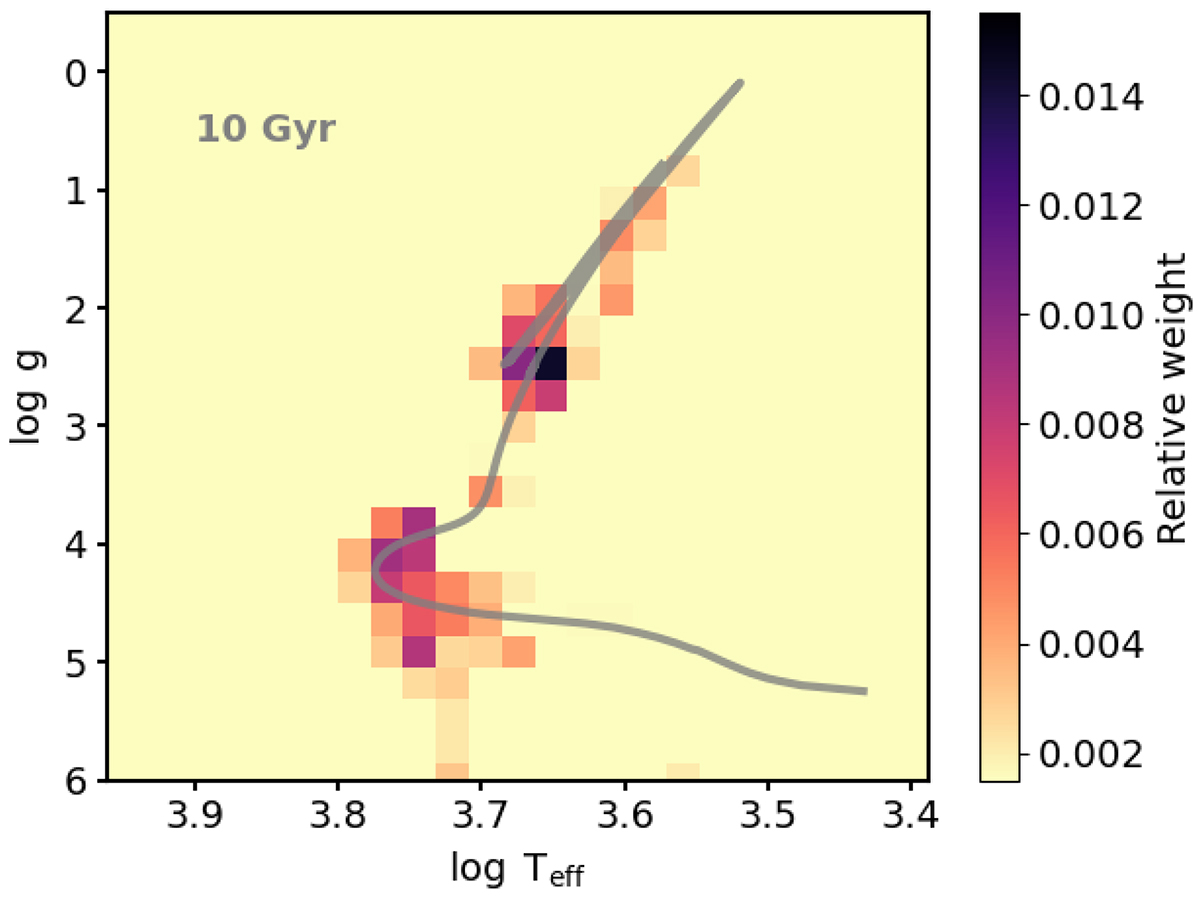
Fig. 1.
Download original image
Best-fitting solution for an SSP model. Each pixel in the image corresponds to the relative flux contribution of stars with different log g and Teff that best reproduce a MILES SSP model of 10 Gyr and solar metallicity. The gray line indicates a theoretical isochrone with the same age and metallicity used to build the MILES SSP model.
Current usage metrics show cumulative count of Article Views (full-text article views including HTML views, PDF and ePub downloads, according to the available data) and Abstracts Views on Vision4Press platform.
Data correspond to usage on the plateform after 2015. The current usage metrics is available 48-96 hours after online publication and is updated daily on week days.
Initial download of the metrics may take a while.