Fig. 7
Download original image
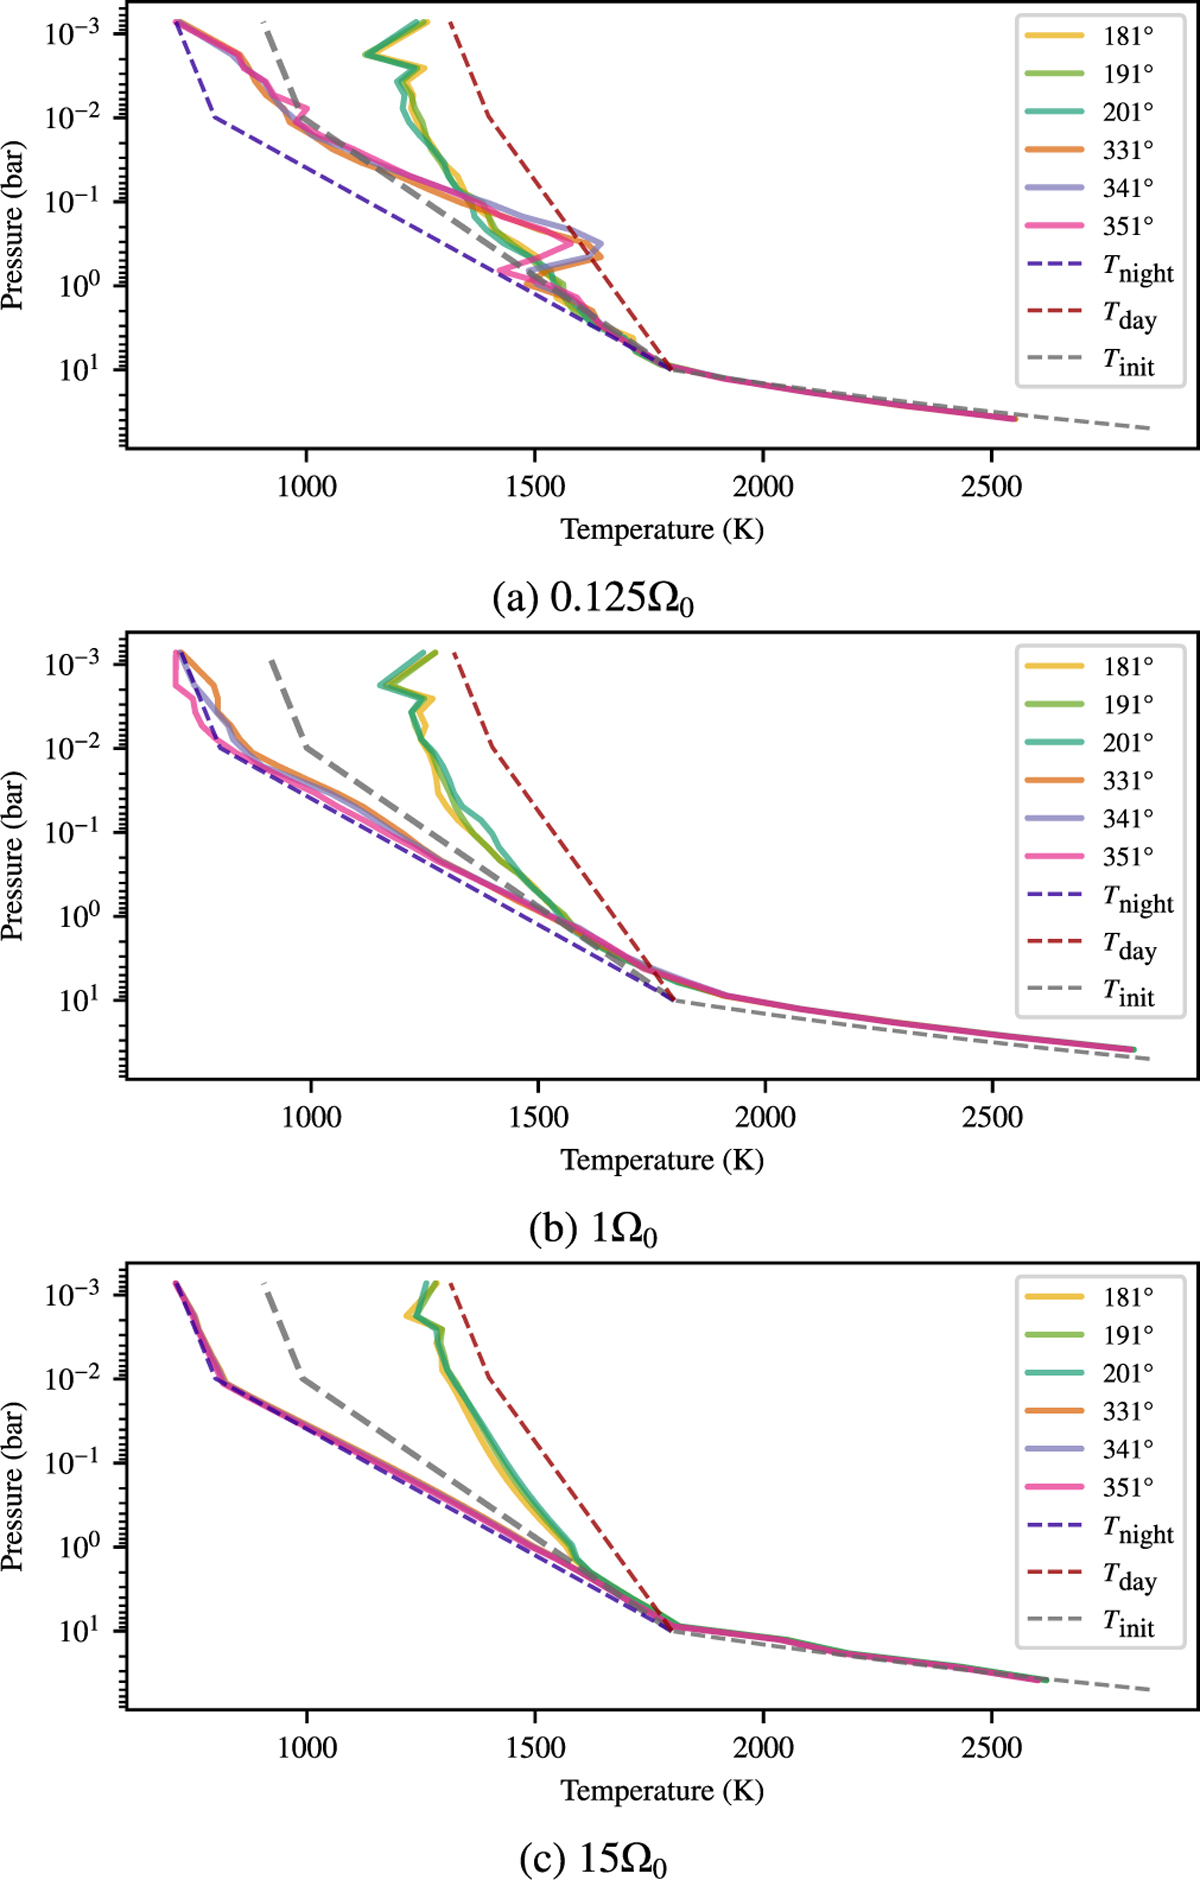
Latitudinally averaged ( over a latitudinal band spanning ±10° of the equator) T-P profiles for three HD209458b-like models at different rotation rates: 0.125Ω0 (top), 1Ω0 (middle), and 15Ω0 (bottom). Each plot includes profiles from six different longitudes, ranging from the sub-stellar point (whose equilibrium profile is shown in red) eastwards to the anti-stellar point (whose equilibrium profile is shown in blue) on the night-side. Here we have excluded the deepest regions of the atmosphere (P > 50bar) from our plots so as to emphasise the changes that occur with longitude at lower pressures, whilst still showing how the deep atmospheric heating changes (compared to the initial adiabat, shown as a dark grey dash) with rotation rate.
Current usage metrics show cumulative count of Article Views (full-text article views including HTML views, PDF and ePub downloads, according to the available data) and Abstracts Views on Vision4Press platform.
Data correspond to usage on the plateform after 2015. The current usage metrics is available 48-96 hours after online publication and is updated daily on week days.
Initial download of the metrics may take a while.