Fig. 6
Download original image
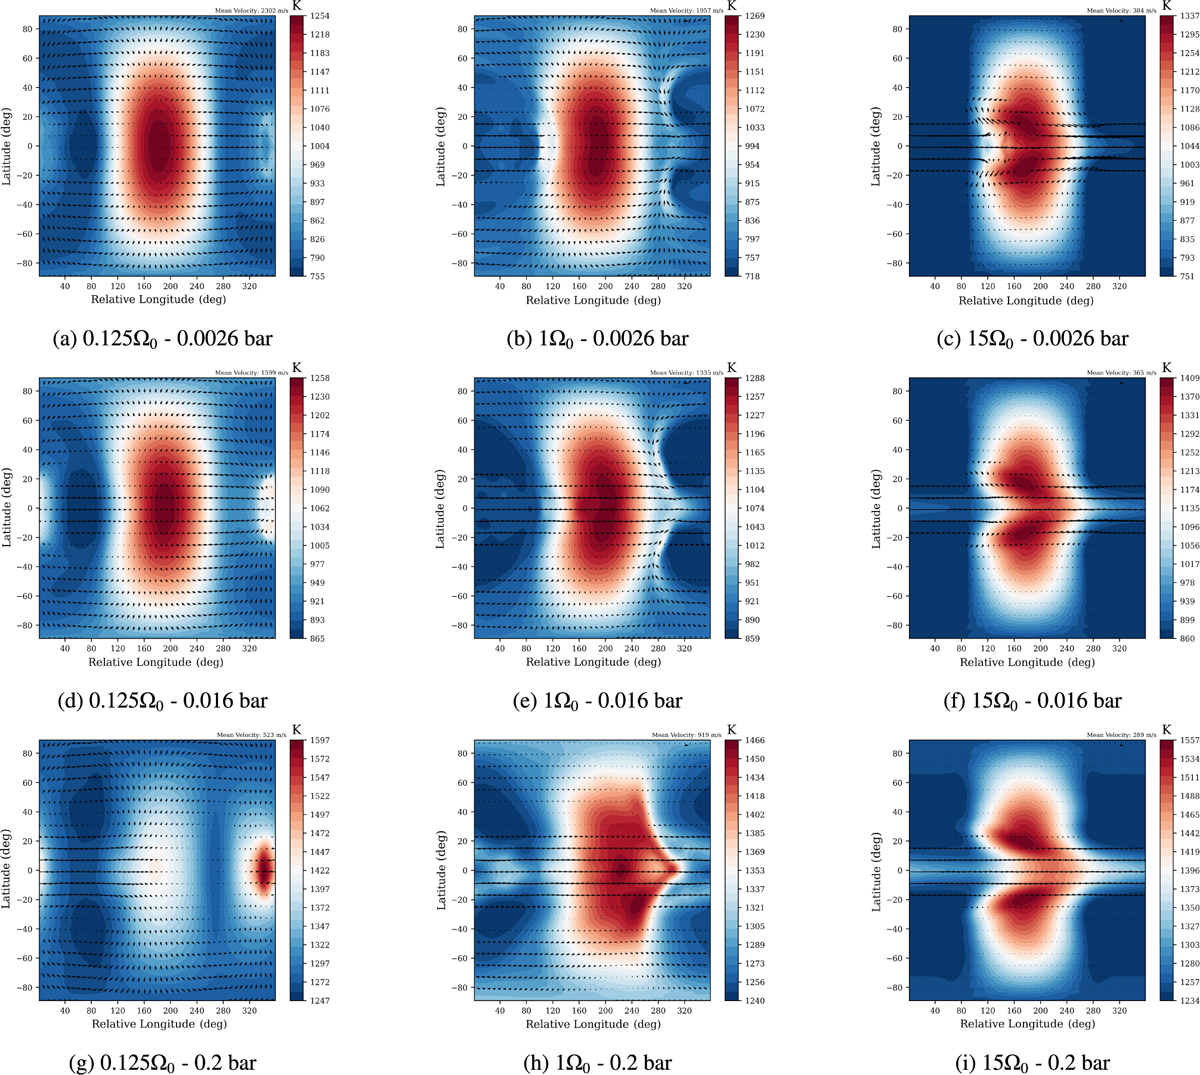
Temporally averaged, over five Earth years of simulation time, zonal wind (quivers) and temperature maps at three different pressures (0.0026 bar, top, to 0.2 bar, bottom) for three HD 209458b-like models at different rotation rates ranging from 0.125Ω0 (left) to 15Ω0 (right). For each pressure level and rotation rate, the RMS wind speed is shown in the top right.
Current usage metrics show cumulative count of Article Views (full-text article views including HTML views, PDF and ePub downloads, according to the available data) and Abstracts Views on Vision4Press platform.
Data correspond to usage on the plateform after 2015. The current usage metrics is available 48-96 hours after online publication and is updated daily on week days.
Initial download of the metrics may take a while.