Fig. 5
Download original image
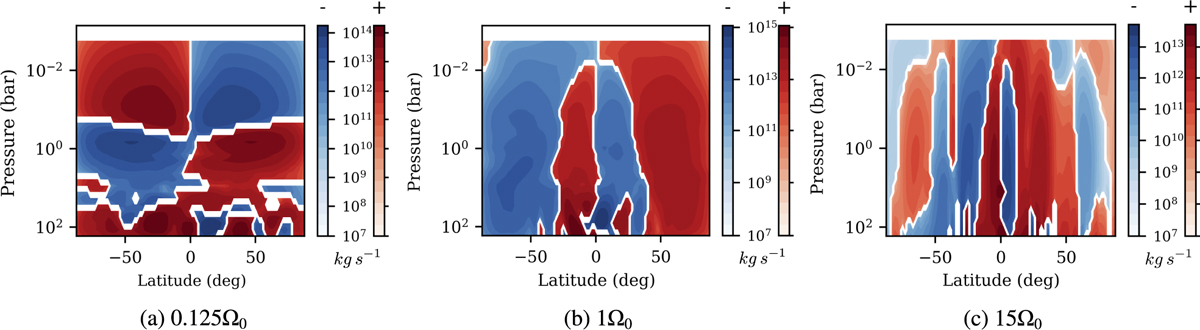
Zonally and temporally, over five Earth years of simulation time, averaged meridional circulation streamfunctions for three HD 209458b- like models with rotation rates of 0.125Ω0 (top), Ω0 (middle), and 15Ω0 (bottom). Here the meridional circulation profile is plotted on a log scale with clockwise circulations shown in red and anti-clockwise circulations shown in blue. At the base rotation rate, for example, these circulations combine at the equator to drive an equatorial downflow at almost all pressures.
Current usage metrics show cumulative count of Article Views (full-text article views including HTML views, PDF and ePub downloads, according to the available data) and Abstracts Views on Vision4Press platform.
Data correspond to usage on the plateform after 2015. The current usage metrics is available 48-96 hours after online publication and is updated daily on week days.
Initial download of the metrics may take a while.