Open Access
Fig. 4
Download original image
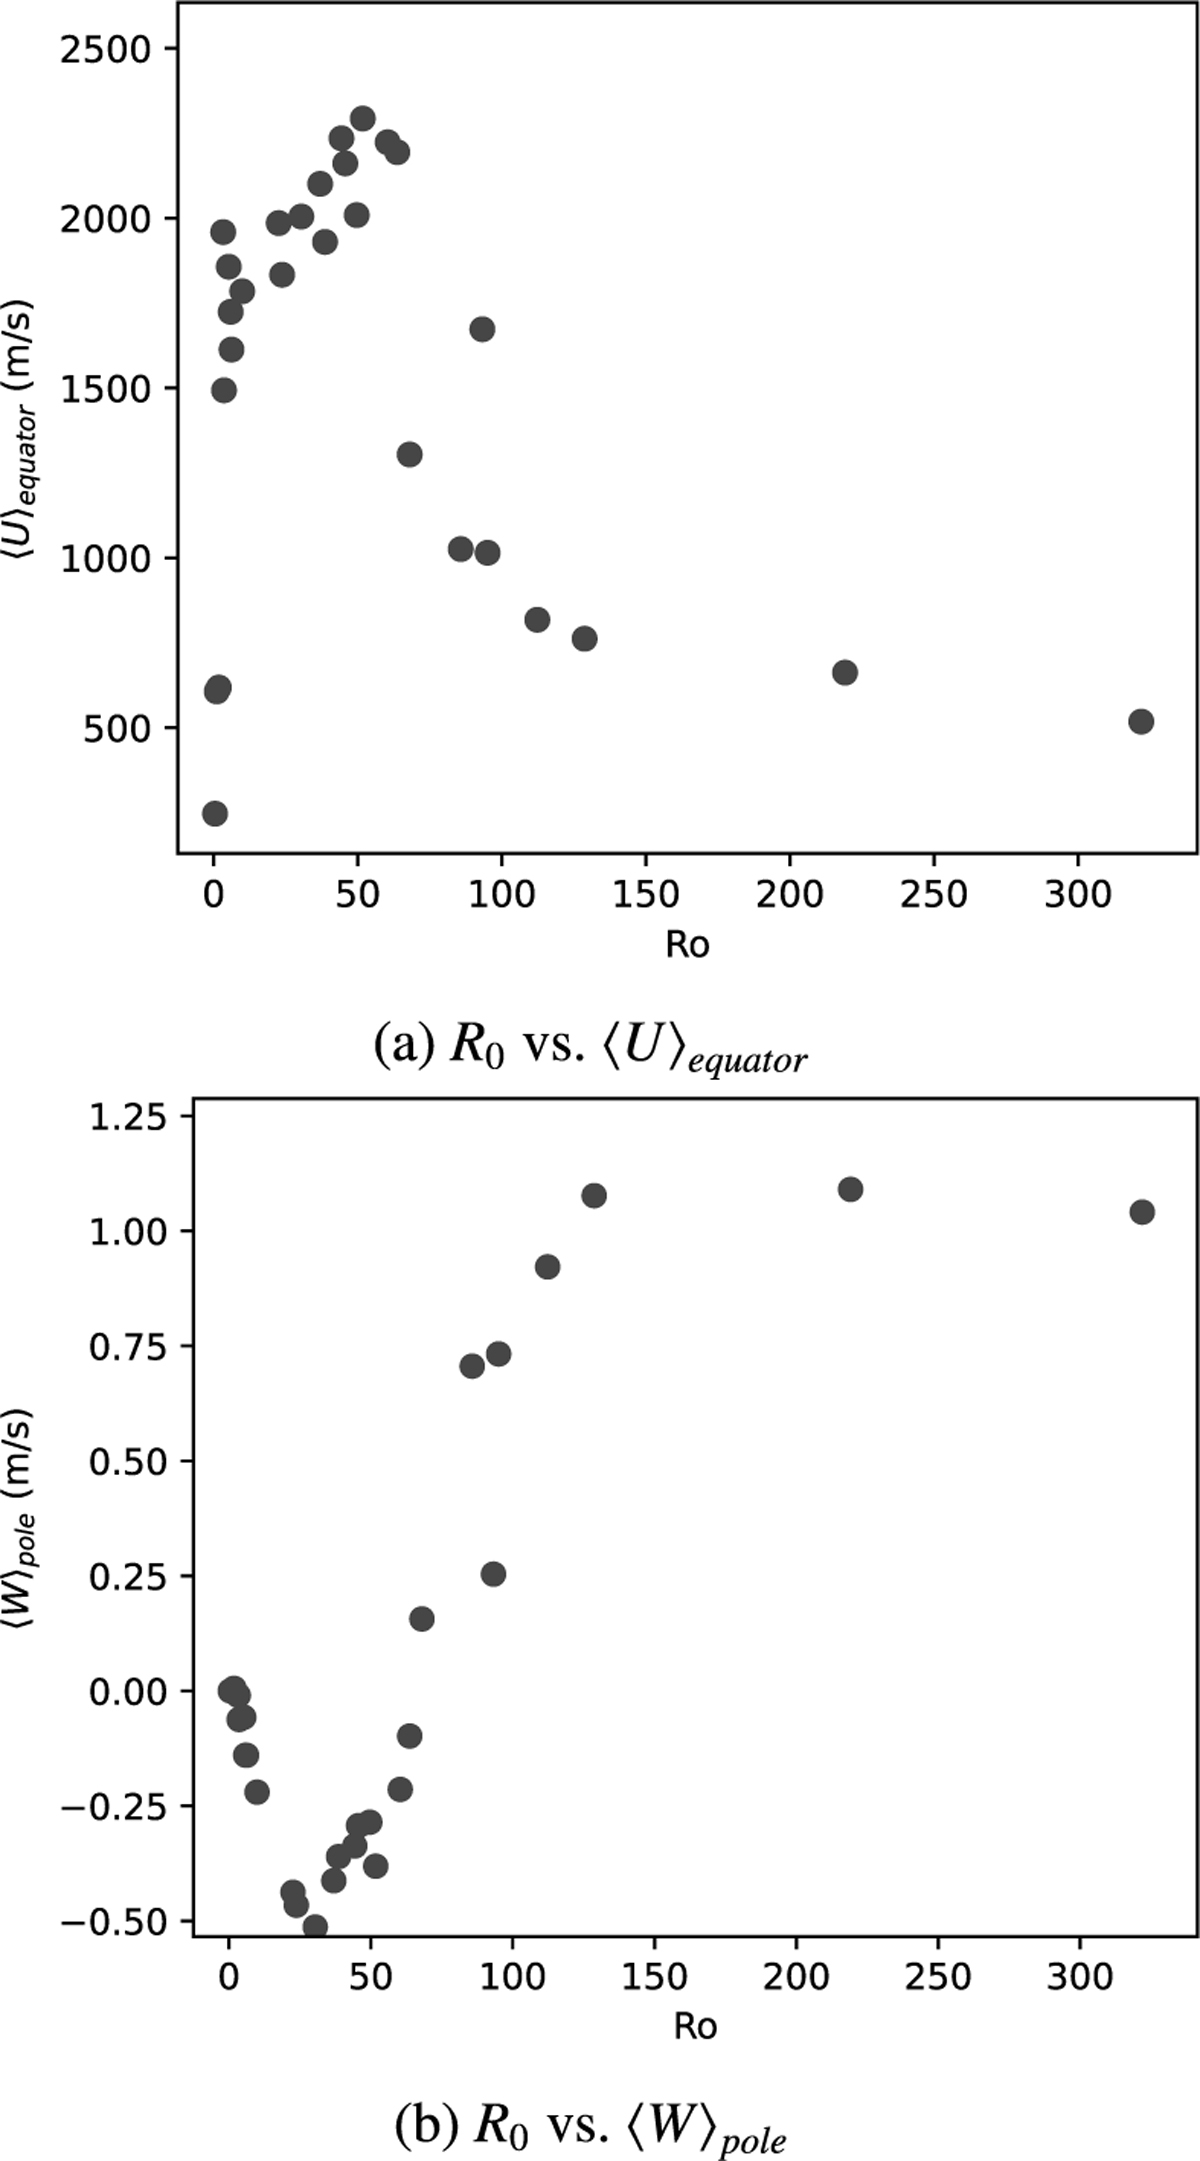
Two plots showing how the mean zonal wind at the equator (top) and mean vertical wind near the northern pole (bottom) vary with global mean Rossby number for 29 HD 209458b-like models spanning the rotation range 0.125Ω0 → 15Ω0.
Current usage metrics show cumulative count of Article Views (full-text article views including HTML views, PDF and ePub downloads, according to the available data) and Abstracts Views on Vision4Press platform.
Data correspond to usage on the plateform after 2015. The current usage metrics is available 48-96 hours after online publication and is updated daily on week days.
Initial download of the metrics may take a while.