Open Access
Fig. 19
Download original image
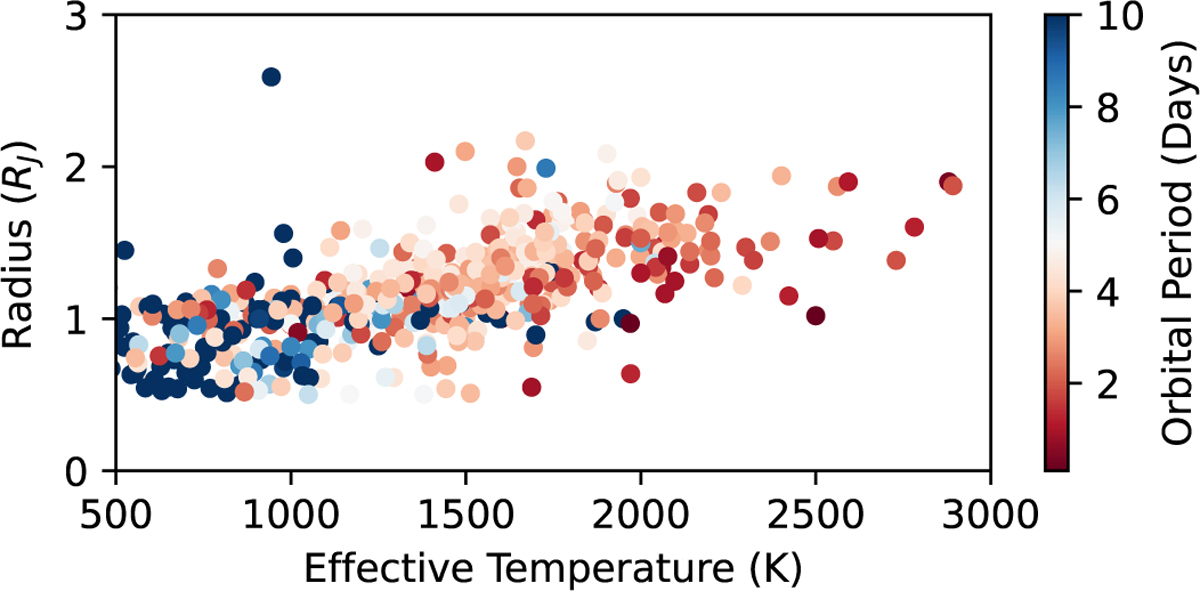
Plot showing the relationship between the radius and effective temperature (i.e. insolation) of Jupiter-mass planets, and how the rotation rate (represented by the colour of each point) modulates inflation. This plot was made using data from exoplanet.eu.
Current usage metrics show cumulative count of Article Views (full-text article views including HTML views, PDF and ePub downloads, according to the available data) and Abstracts Views on Vision4Press platform.
Data correspond to usage on the plateform after 2015. The current usage metrics is available 48-96 hours after online publication and is updated daily on week days.
Initial download of the metrics may take a while.