Fig. 17
Download original image
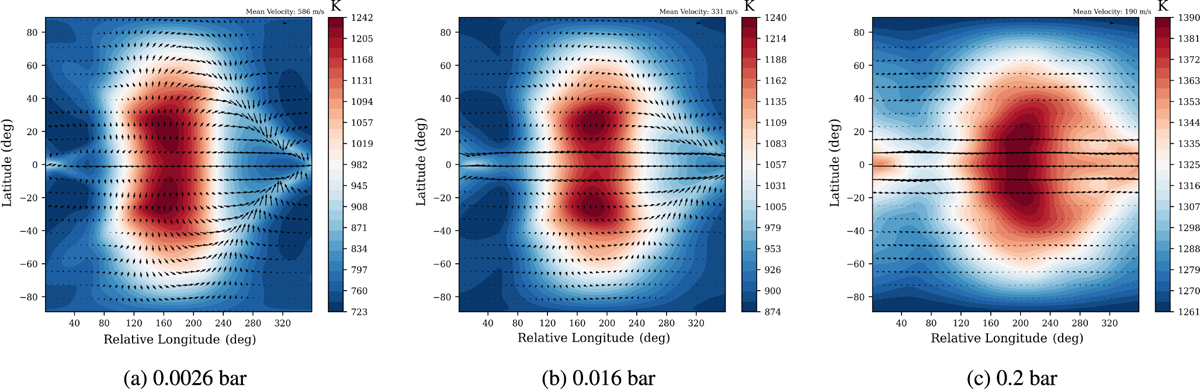
Temporally averaged, over five Earth years of simulation time, zonal wind (arrows) and temperature maps at three different pressures (0.0026 bar, left, 0.016 bar, centre, and 0.2 bar, right) for a non-synchronous HD 209458b-like model in which the difference between the rotational and orbital periods is large (Ωrot = 4Ωorb = 4Ω0). Here we have forgone showing the weakly non-synchronous regime as we have already established its similarity to its synchronous equivalent. We note that the x-axis of these plots is relative-longitude, indicating that we have taken the temporal mean of the wind and temperature in the frame of reference of the irradiation.
Current usage metrics show cumulative count of Article Views (full-text article views including HTML views, PDF and ePub downloads, according to the available data) and Abstracts Views on Vision4Press platform.
Data correspond to usage on the plateform after 2015. The current usage metrics is available 48-96 hours after online publication and is updated daily on week days.
Initial download of the metrics may take a while.