Fig. 12
Download original image
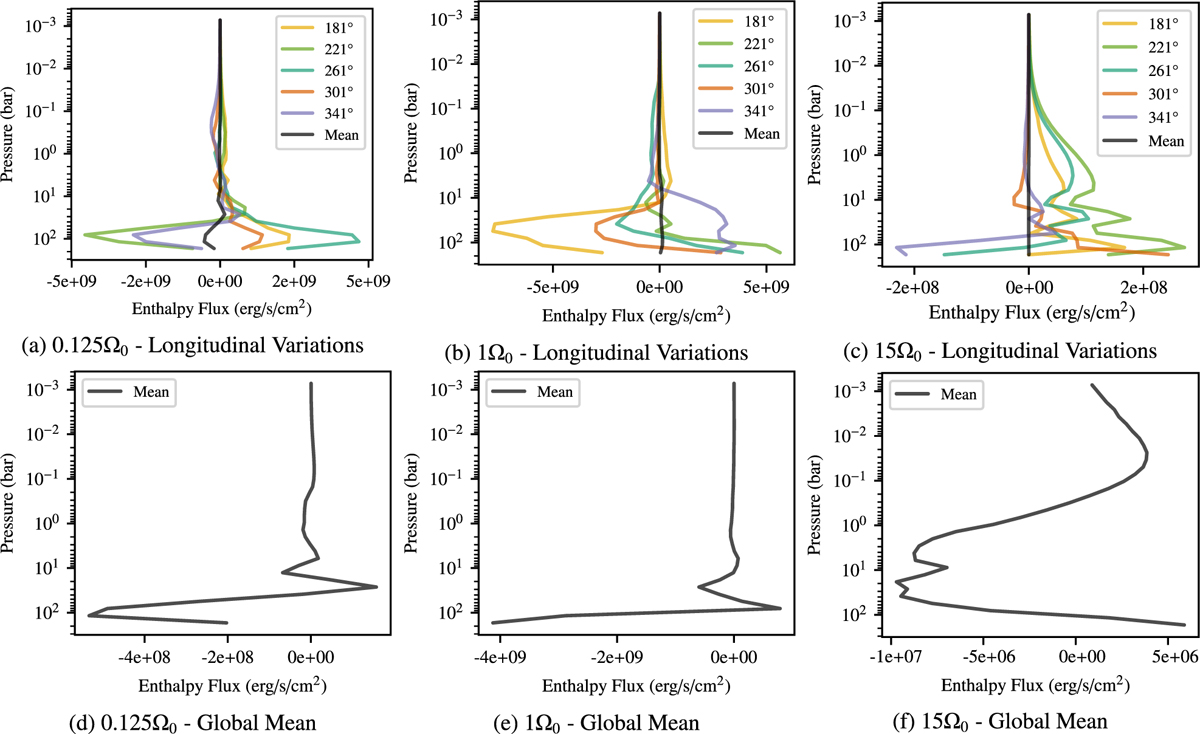
Longitudinal variations (top) and global means (bottom) of the vertical enthalpy flux Fℋ profiles for three exemplary HD 209458b-like models: 0.125Ω0 (left), Ω0 (middle), and 15Ω0 (right). In the top row, we plot vertical enthalpy flux profiles at five different longitudes, ranging from the sub-stellar point to just west of the anti-stellar point, as well as the mean enthalpy flux profile. However, since the mean flux is significantly smaller than the local fluxes, we replot the mean profiles in the bottom row such as to better demonstrate the vertical variations in enthalpy transport.
Current usage metrics show cumulative count of Article Views (full-text article views including HTML views, PDF and ePub downloads, according to the available data) and Abstracts Views on Vision4Press platform.
Data correspond to usage on the plateform after 2015. The current usage metrics is available 48-96 hours after online publication and is updated daily on week days.
Initial download of the metrics may take a while.