Fig. 11
Download original image
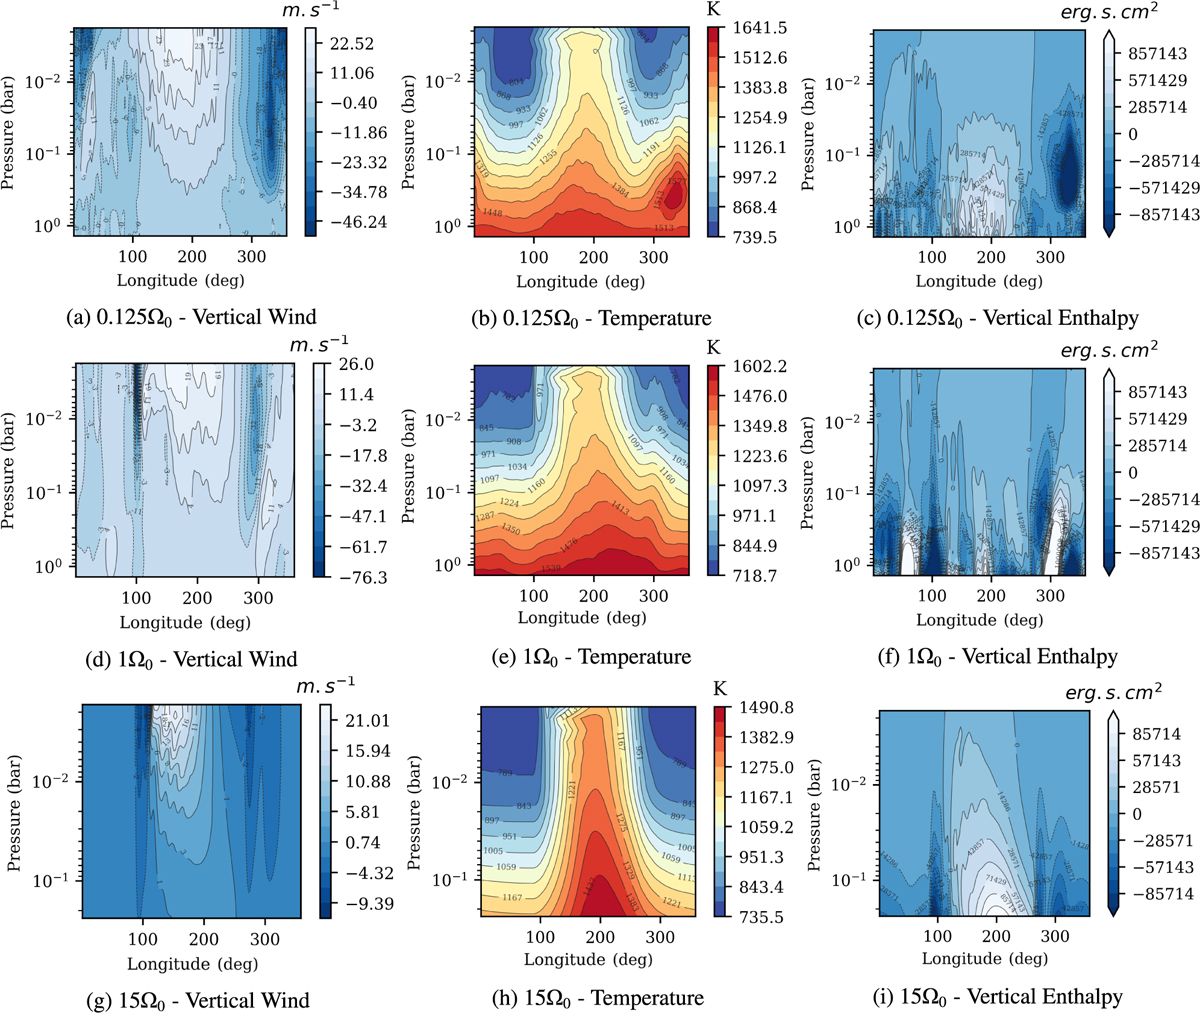
Maps showing longitudinal slices of the Vertical Wind (left), Temperature (middle), and Vertical Enthalpy Flux (right), at the equator, for three exemplary HD209458b-like models with rotation rates of 0.125Ω0 (top), Ω0 (middle), and 15Ω0 (bottom). Here we have confined our plots to pressures less than 0.26 bar in order to emphasise the dynamics and transport in the outer and mid atmosphere, particularly at pressure levels similar to those at which the night-side hot-spot forms. We note the difference in scale for the vertical enthalpy flux in our 15Ω0 case, emphasising the weaker vertical transport, even at the equator, in the rapidly rotating regime.
Current usage metrics show cumulative count of Article Views (full-text article views including HTML views, PDF and ePub downloads, according to the available data) and Abstracts Views on Vision4Press platform.
Data correspond to usage on the plateform after 2015. The current usage metrics is available 48-96 hours after online publication and is updated daily on week days.
Initial download of the metrics may take a while.