Fig. 10
Download original image
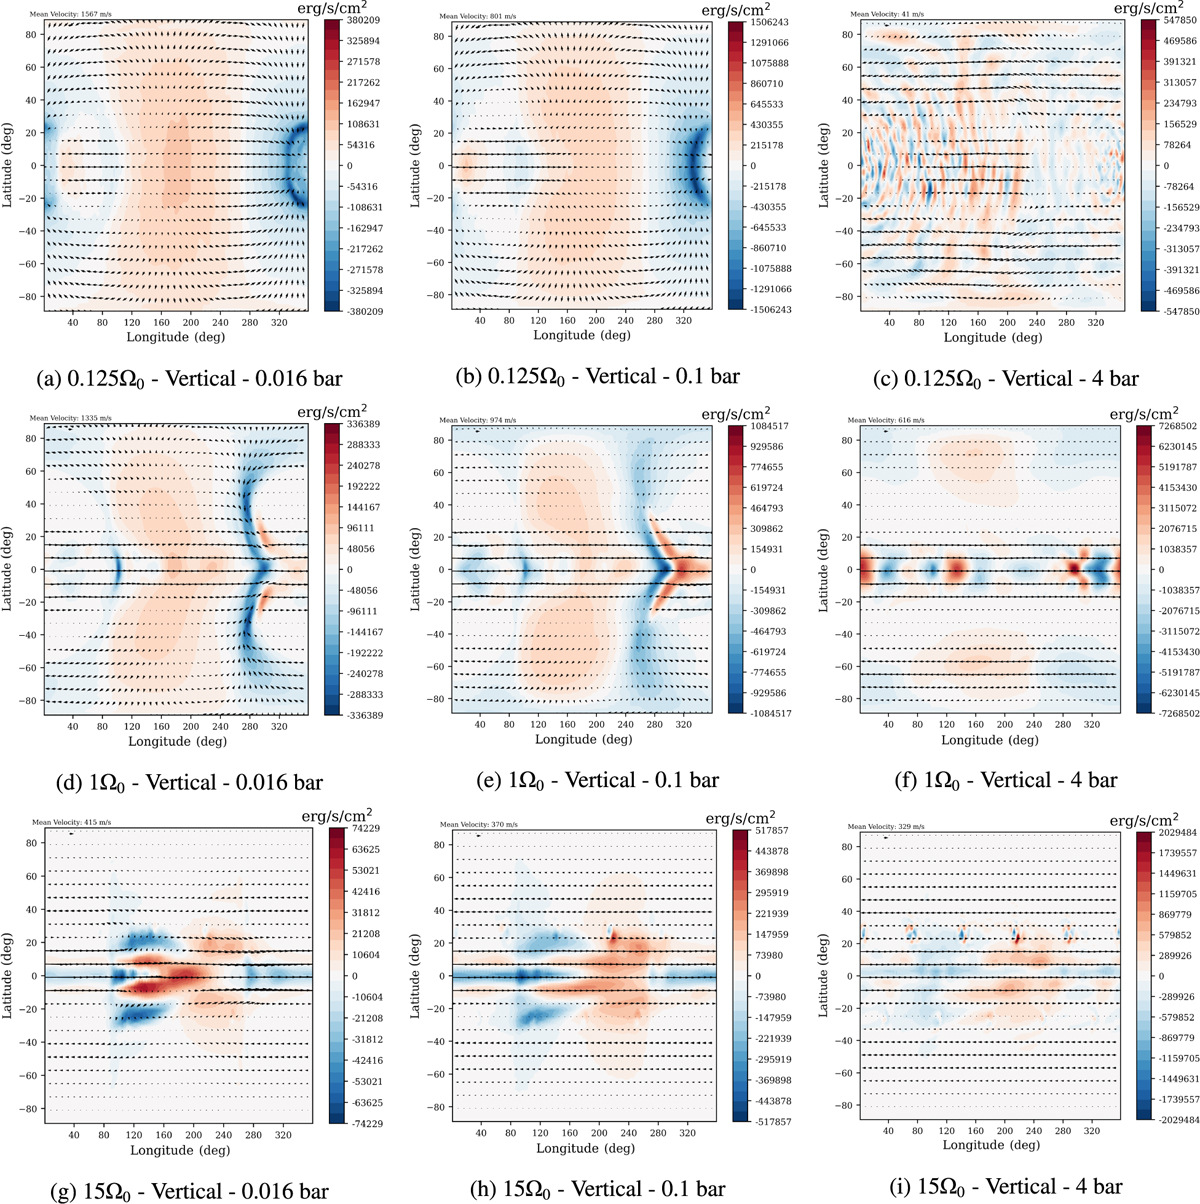
Continued from previous page: Maps showing the zonal, meridional, and vertical enthalpy transport at select pressure levels for three exemplary HD 209458b-like models with rotation rates of 0.125Ω0 (top), Ω0 (middle), and 15Ω0 (bottom). Here, positive (red) fluxes represent eastward, polewards, or outwards flows for the zonal, meridional, or vertical enthalpy flux maps respectively.
Current usage metrics show cumulative count of Article Views (full-text article views including HTML views, PDF and ePub downloads, according to the available data) and Abstracts Views on Vision4Press platform.
Data correspond to usage on the plateform after 2015. The current usage metrics is available 48-96 hours after online publication and is updated daily on week days.
Initial download of the metrics may take a while.