Open Access
Fig. 7
Download original image
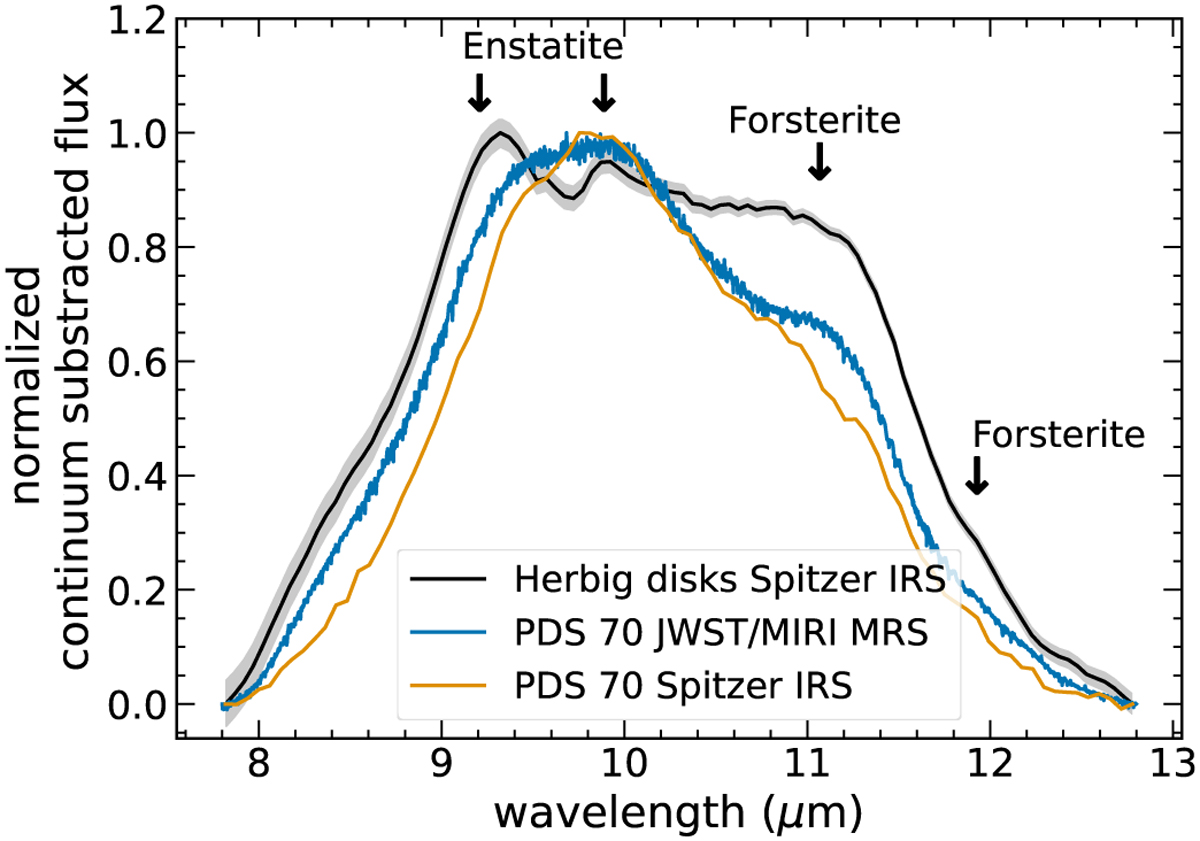
10 μm silicate band of the MIRI (blue) and Spitzer (orange) spectra of PDS 70 compared to nine Herbig Ae/Be stars, observed by Spitzer IRS (gray). The arrows at 9.2 μm and 9.8 μm indicate the enstatite bands, while the arrows at 11 μm and 11.9 μm indicate the forsterite bands based on GRF opacities.
Current usage metrics show cumulative count of Article Views (full-text article views including HTML views, PDF and ePub downloads, according to the available data) and Abstracts Views on Vision4Press platform.
Data correspond to usage on the plateform after 2015. The current usage metrics is available 48-96 hours after online publication and is updated daily on week days.
Initial download of the metrics may take a while.