Fig. 5
Download original image
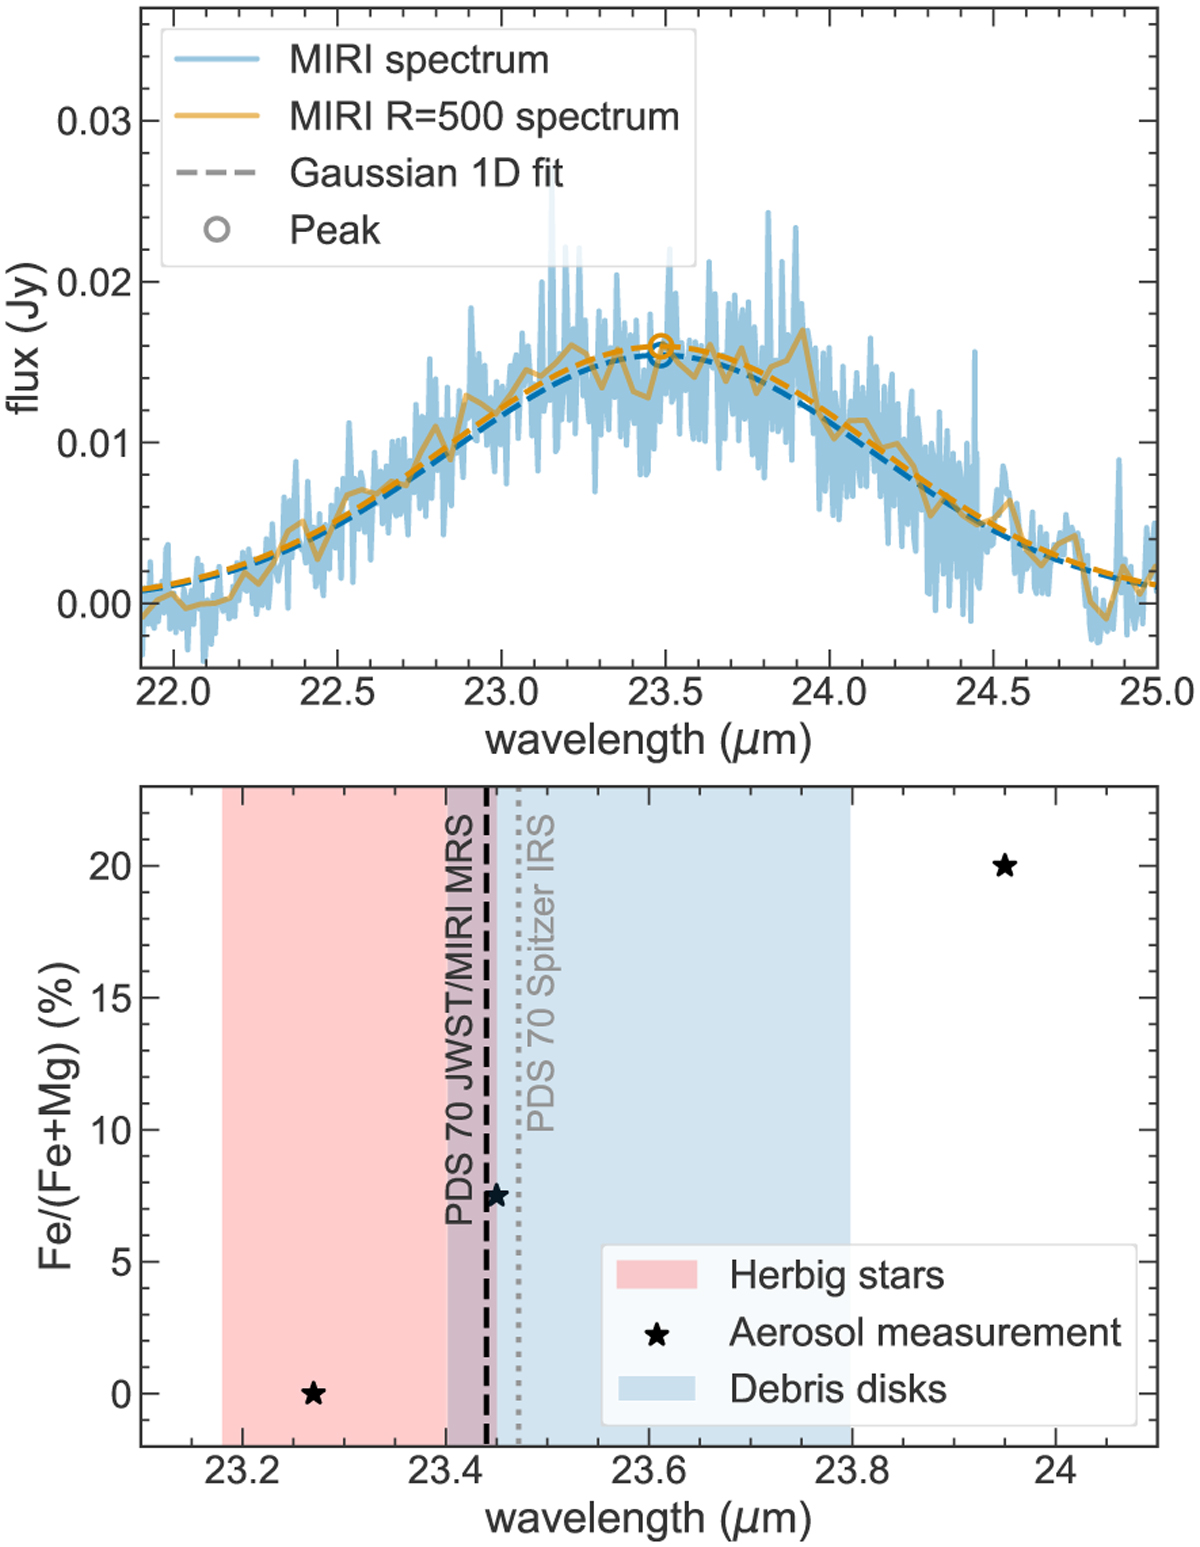
Measurement of the 23–24 μm band peak. The MIRI spectrum was fit with a 1D Gaussian curve (dashed blue line) and found the peak at 23.4 μm (blue circle) in the upper panel. MIRI spectrum with R=500 is also plotted and fit with the 1D Gaussian curve (solid and dashed yellow lines), and the Gaussian curve also peaks at 23.4 μm (yellow circle). The lower panel shows the locations of the peaks for the MIRI and Spitzer spectra, together with Aerosol measurements (illustrated in Olofsson et al. 2012). The regions where the peaks are located for Herbig Ae/Be stars and debris disks are shaded in red and blue, respectively.
Current usage metrics show cumulative count of Article Views (full-text article views including HTML views, PDF and ePub downloads, according to the available data) and Abstracts Views on Vision4Press platform.
Data correspond to usage on the plateform after 2015. The current usage metrics is available 48-96 hours after online publication and is updated daily on week days.
Initial download of the metrics may take a while.