Open Access
Fig. 3
Download original image
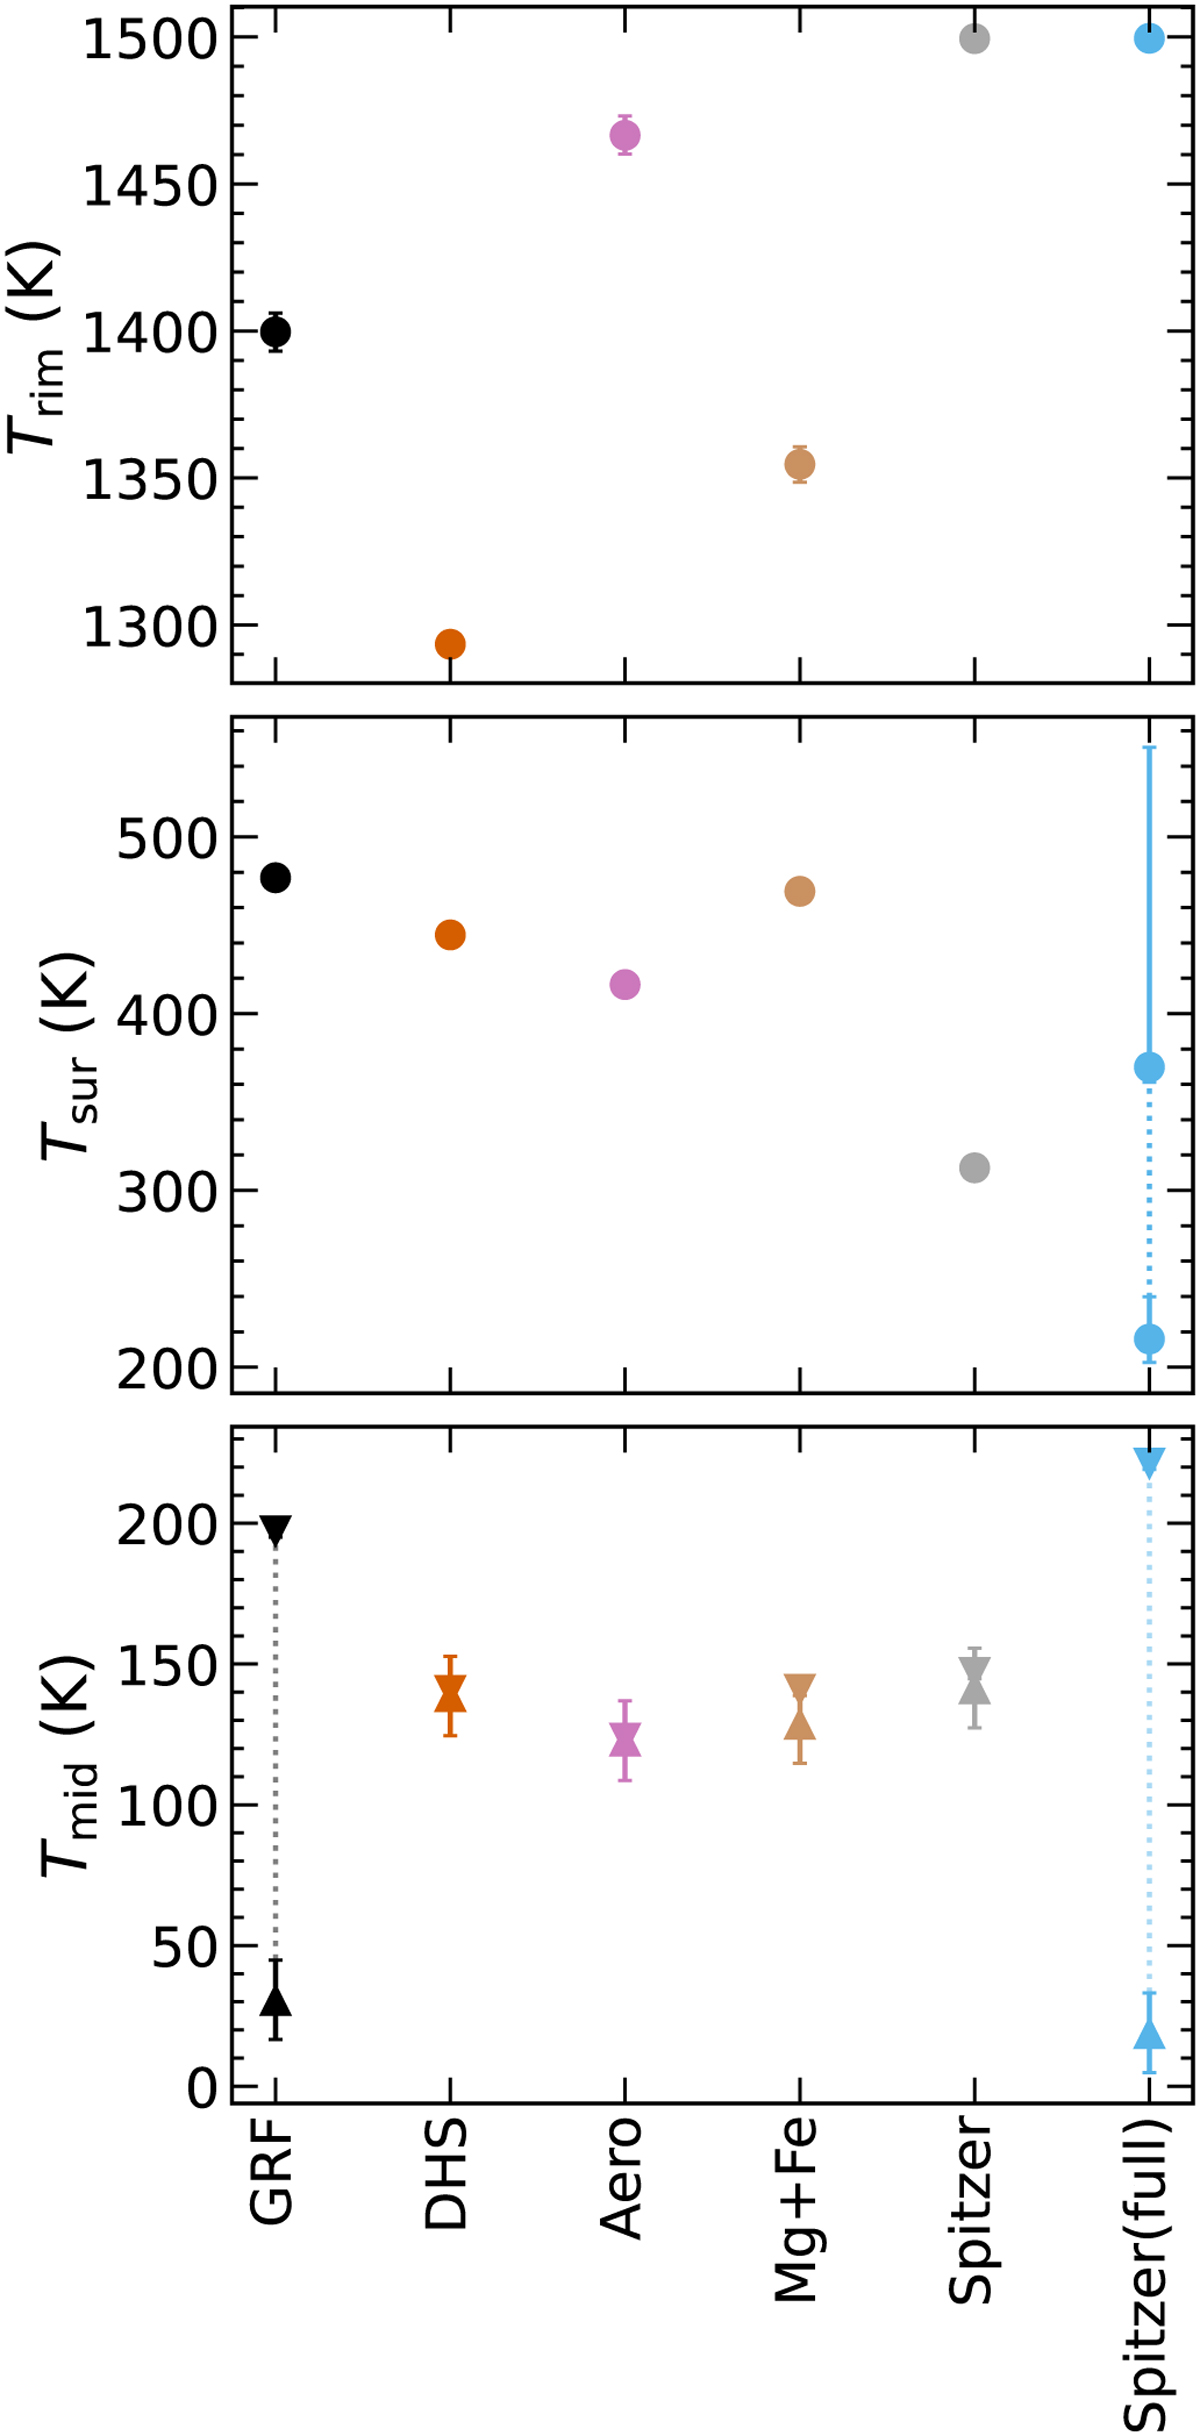
Temperatures of dust in the inner rim (top), disk surface (middle), and midplane (bottom) of dust fitting models in Table A.1. For Spitzer (full), the dotted line in the temperature of the disk surface indicates the temperature gradient across the disk surface; the other models assume a single temperature.
Current usage metrics show cumulative count of Article Views (full-text article views including HTML views, PDF and ePub downloads, according to the available data) and Abstracts Views on Vision4Press platform.
Data correspond to usage on the plateform after 2015. The current usage metrics is available 48-96 hours after online publication and is updated daily on week days.
Initial download of the metrics may take a while.