Fig. 1
Download original image
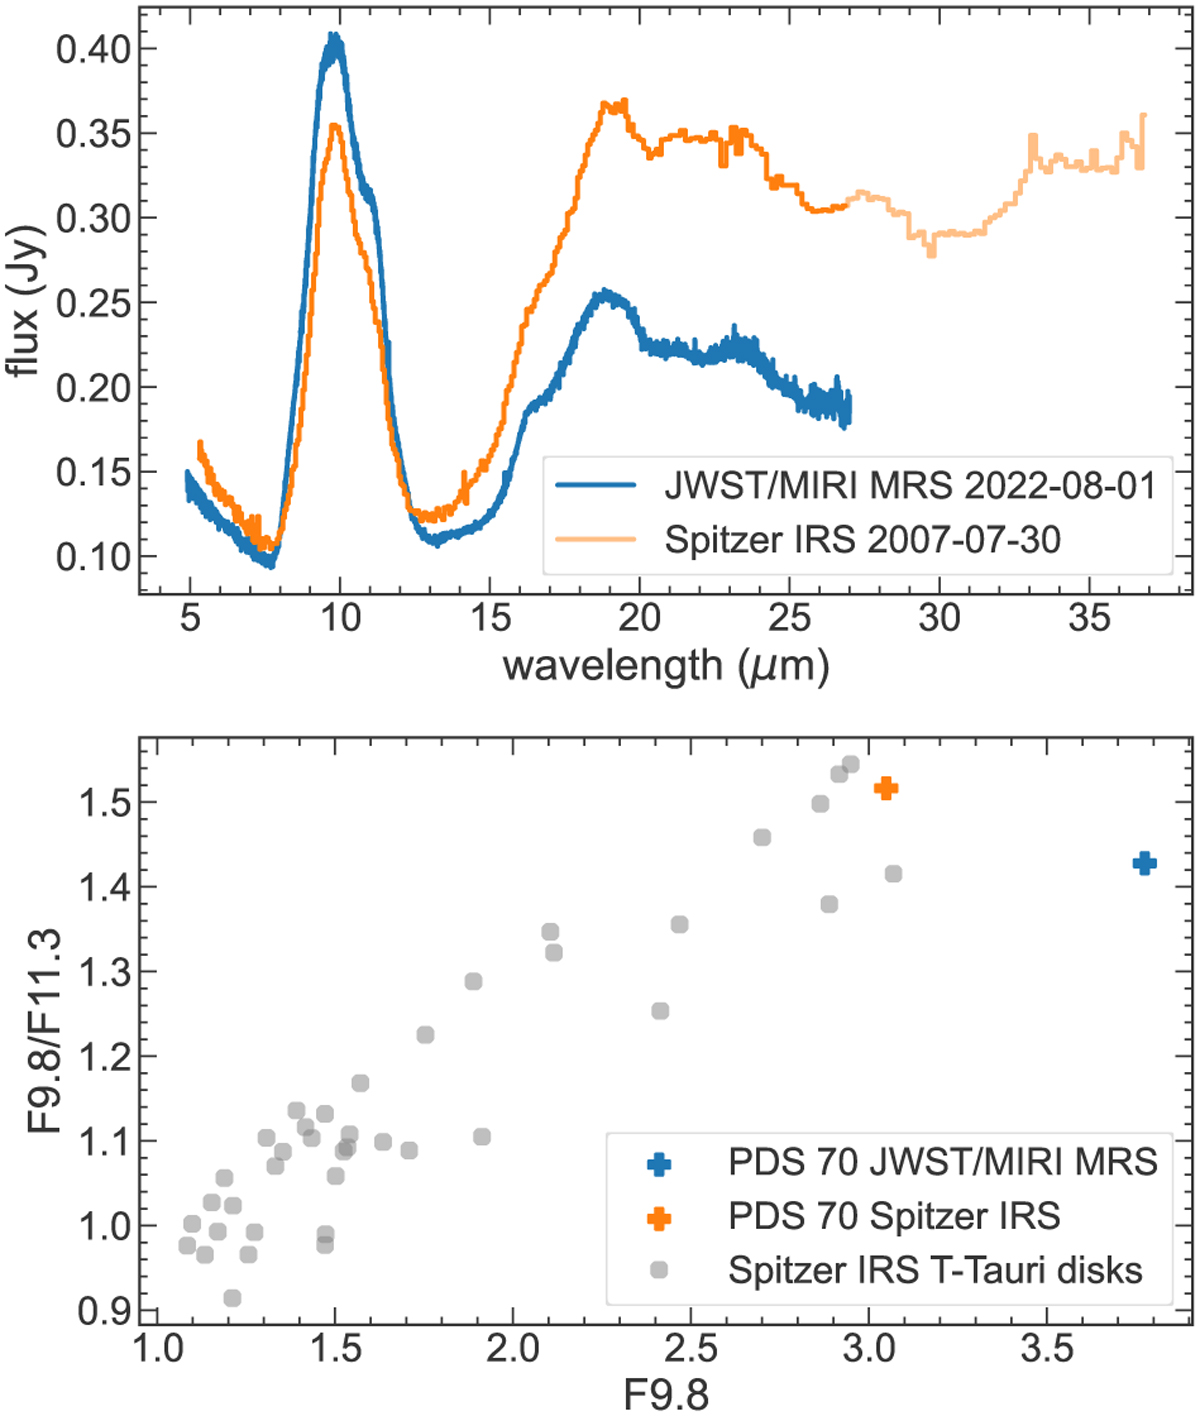
MIRI and Spitzer spectra of PDS 70 and their shapes of 10 μm silicate bands. Upper: MIRI spectrum in blue and Spitzer spectrum in orange. The light orange shows the full wavelength range of the Spitzer spectrum. Around 10 μm, the MIRI spectrum has a higher flux and broader silicate band, while the Spitzer spectrum shows higher flux levels beyond 12 μm. Lower: band strength at 9.8 μm and the shape of 10 μm silicate band. Gray dots are disks in the CASSIS database with low-resolution spectra. The blue cross is the MIRI spectrum, while the orange cross is the Spitzer spectrum.
Current usage metrics show cumulative count of Article Views (full-text article views including HTML views, PDF and ePub downloads, according to the available data) and Abstracts Views on Vision4Press platform.
Data correspond to usage on the plateform after 2015. The current usage metrics is available 48-96 hours after online publication and is updated daily on week days.
Initial download of the metrics may take a while.