Fig. 7
Download original image
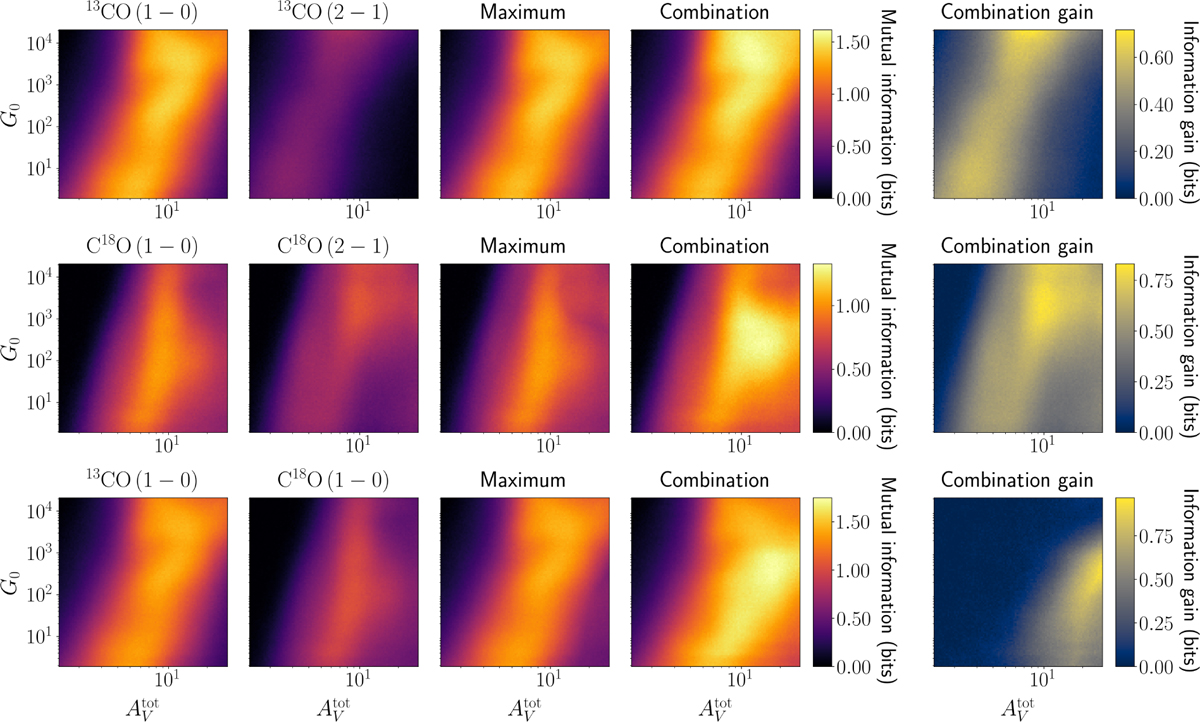
Mutual information maps between ![]() and CO isotopologues lines. The first and second columns show the maps for individual lines while the third and fourth columns show the pixel-wise maximum and the combination maps, respectively. The last column shows the difference between the last two maps and corresponds to the amount of information gained by combining lines instead of considering only the most informative individual line.
and CO isotopologues lines. The first and second columns show the maps for individual lines while the third and fourth columns show the pixel-wise maximum and the combination maps, respectively. The last column shows the difference between the last two maps and corresponds to the amount of information gained by combining lines instead of considering only the most informative individual line.
Current usage metrics show cumulative count of Article Views (full-text article views including HTML views, PDF and ePub downloads, according to the available data) and Abstracts Views on Vision4Press platform.
Data correspond to usage on the plateform after 2015. The current usage metrics is available 48-96 hours after online publication and is updated daily on week days.
Initial download of the metrics may take a while.