Fig. 4
Download original image
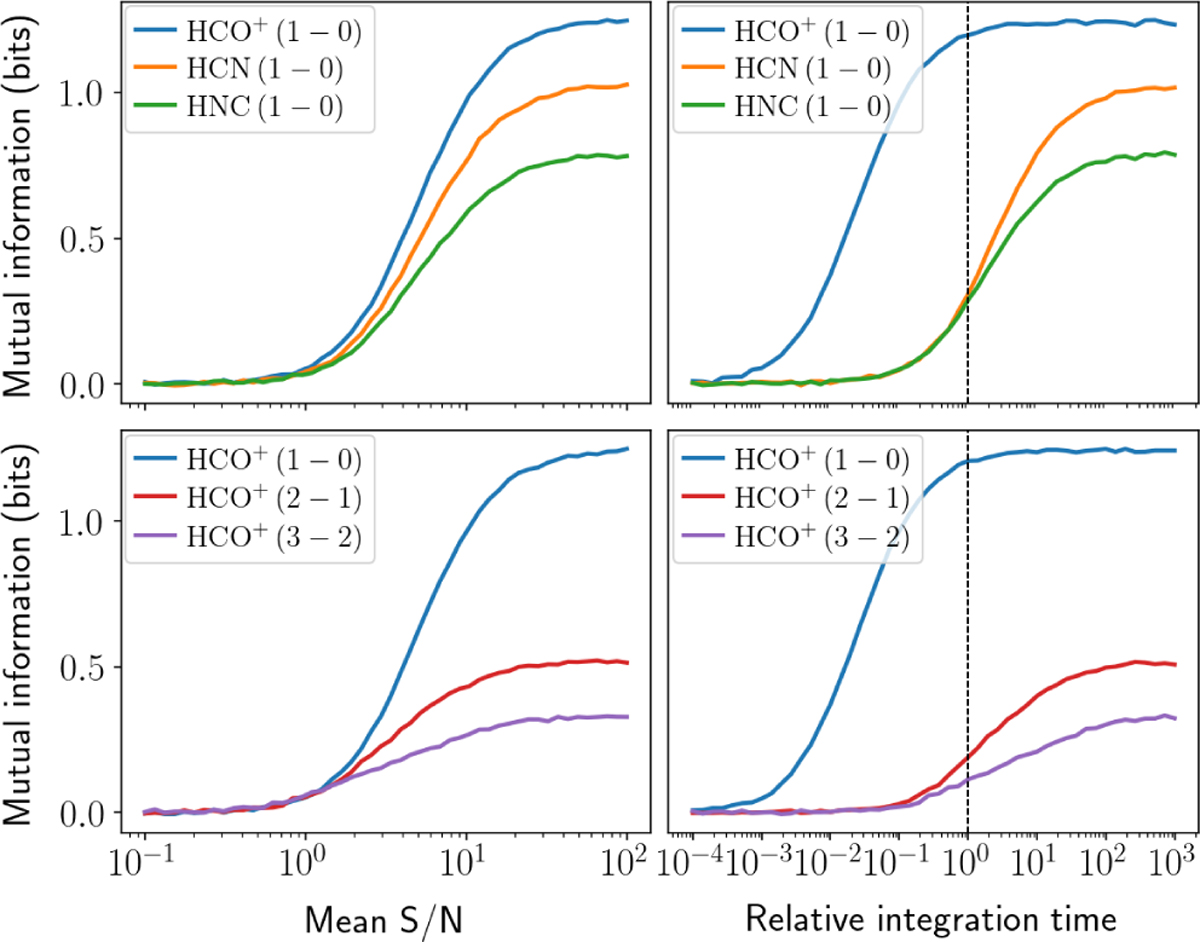
Evolution of mutual information between the visual extinction ![]() and integrated line intensities as a function of S/N (left column) and integration time (right column), for
and integrated line intensities as a function of S/N (left column) and integration time (right column), for ![]() (filamentary clouds). The top row shows the comparison between some chemical species, while the bottom row shows the comparison between the three lower energy transitions of HCO+.
(filamentary clouds). The top row shows the comparison between some chemical species, while the bottom row shows the comparison between the three lower energy transitions of HCO+.
Current usage metrics show cumulative count of Article Views (full-text article views including HTML views, PDF and ePub downloads, according to the available data) and Abstracts Views on Vision4Press platform.
Data correspond to usage on the plateform after 2015. The current usage metrics is available 48-96 hours after online publication and is updated daily on week days.
Initial download of the metrics may take a while.