Fig. 3
Download original image
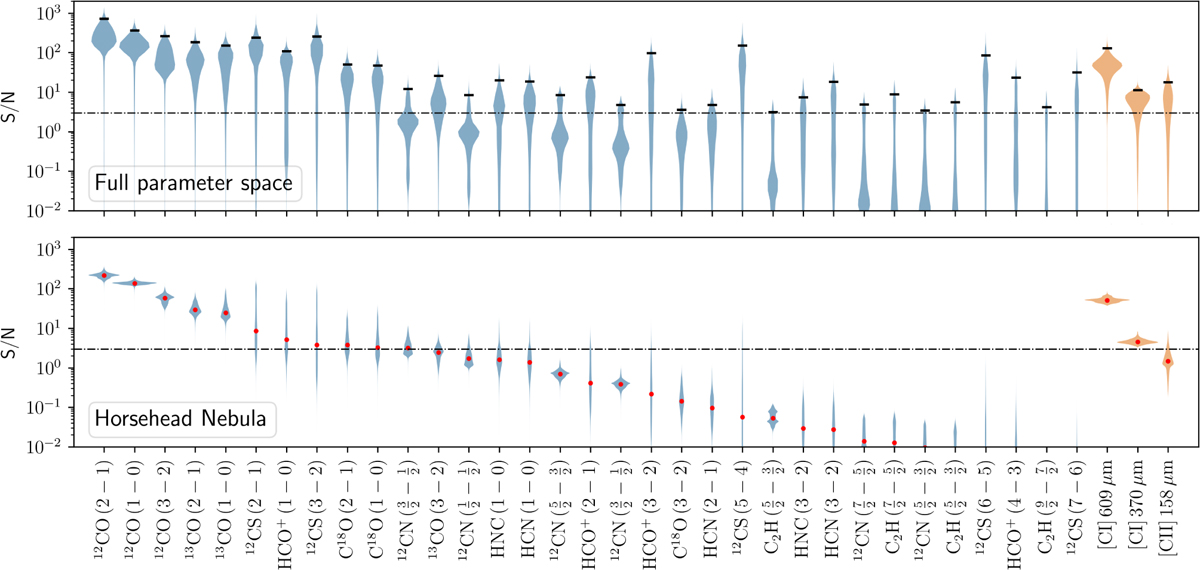
Violin plots of the S/N of the spectral lines considered in this study, with the S/N defined as fℓ(θ)/σa,ℓ. The EMIR lines are displayed in blue on the left, while the [CI] and [CII] lines are shown in orange on the right. Top: S/N distributions for a loguniform distribution on the full validity intervals on the physical parameters. The considered line filter only keeps lines that have a 99% percentile S/N greater than 3. This threshold is indicated with the horizontal dashed black line, and the actual 99% percentile S/N is shown with a short black line for each line. Bottom: S/N distributions in an environment similar to the Horsehead pillar, for the same lines. The lines are ranked by decreasing median S/N, indicated in red.
Current usage metrics show cumulative count of Article Views (full-text article views including HTML views, PDF and ePub downloads, according to the available data) and Abstracts Views on Vision4Press platform.
Data correspond to usage on the plateform after 2015. The current usage metrics is available 48-96 hours after online publication and is updated daily on week days.
Initial download of the metrics may take a while.