Fig. J.1
Download original image
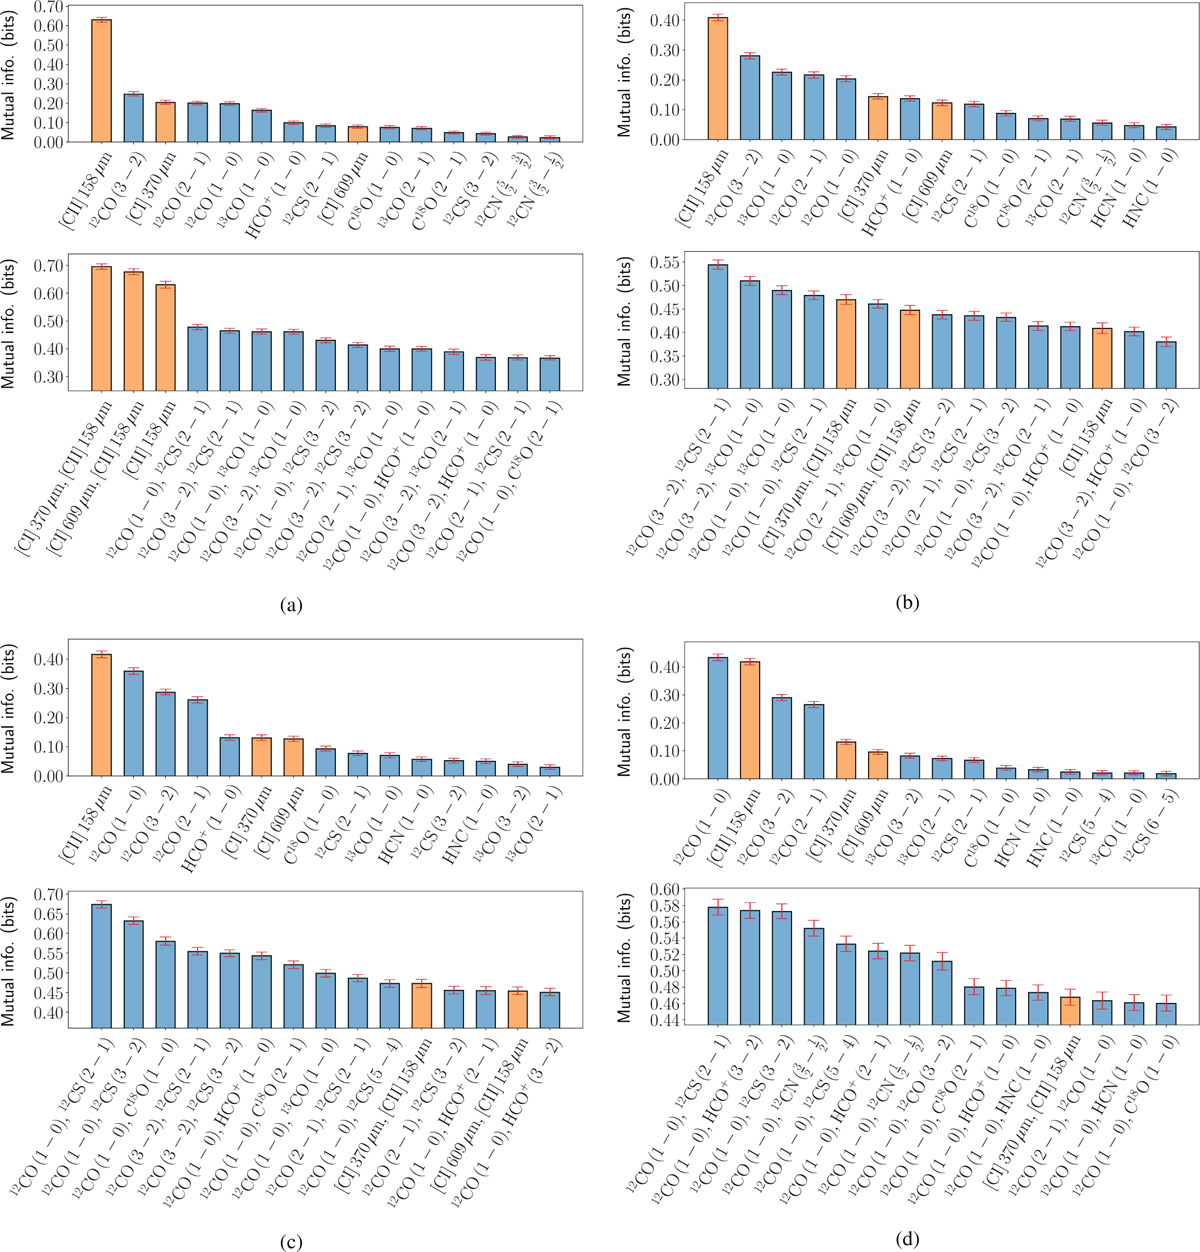
Line selection for G0 in an environment similar to the Horsehead pillar, for the reference use case (reference integration time and no scaling factor, κ, in the observation simulator). The analysis is performed for different regimes of ![]() : all environments (
: all environments (![]() , panel a), translucent gas (
, panel a), translucent gas (![]() , panel b), filamentary gas (
, panel b), filamentary gas (![]() , panel c), and dense cores (
, panel c), and dense cores (![]() , panel d). Orange bars correspond to [CI] and [CII] lines.
, panel d). Orange bars correspond to [CI] and [CII] lines.
Current usage metrics show cumulative count of Article Views (full-text article views including HTML views, PDF and ePub downloads, according to the available data) and Abstracts Views on Vision4Press platform.
Data correspond to usage on the plateform after 2015. The current usage metrics is available 48-96 hours after online publication and is updated daily on week days.
Initial download of the metrics may take a while.