Fig. I.1
Download original image
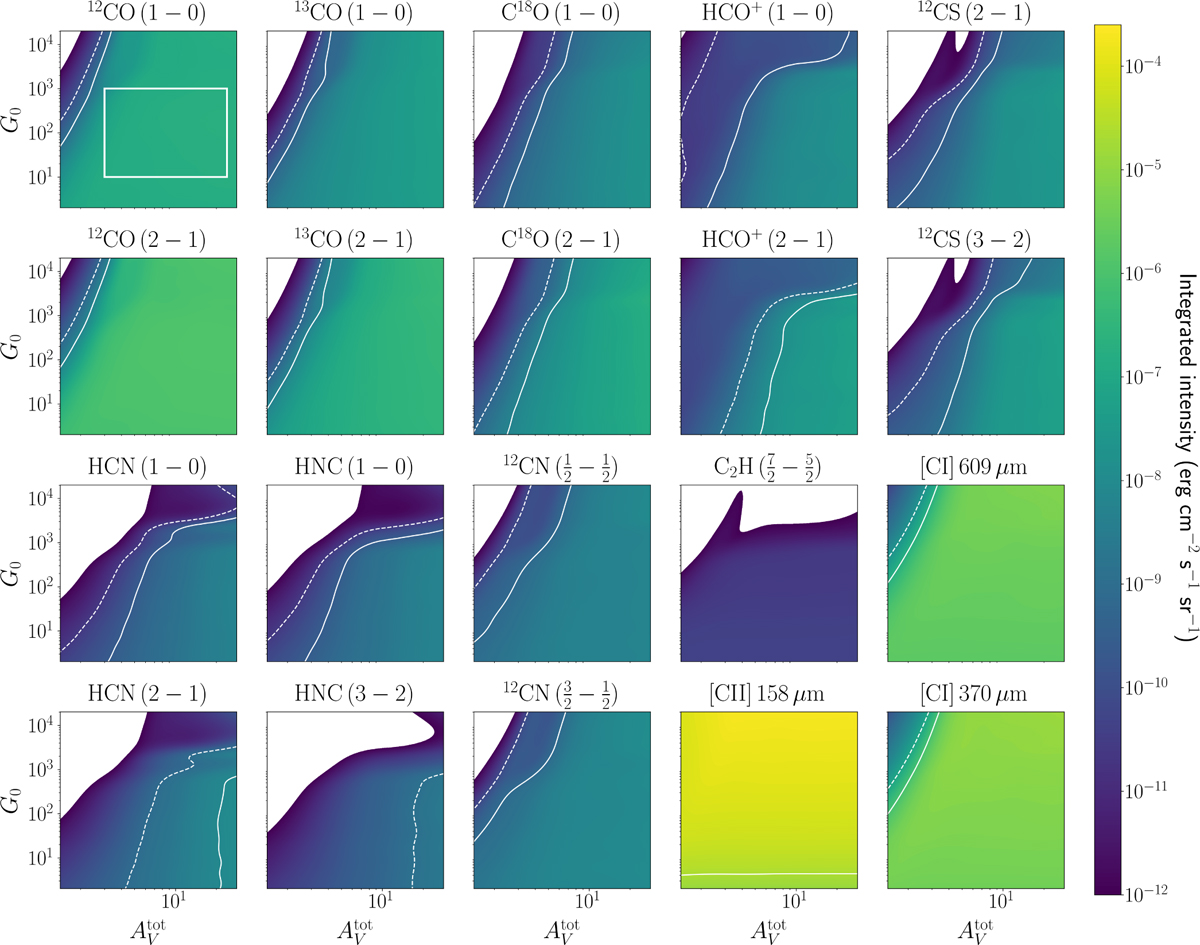
Predicted integrated intensities fℓ(θ) as a function of ![]() or G0, with Pth = 105 K cm−3. The white full line represents the standard deviation of the additive noise, σa,ℓ, from Eq. 15 for the ORION-B observations (Pety et al. 2017). The dashed white line indicates the standard deviation with a ten times longer integration time (deeper integration use case). The regions with integrated intensities lower than 10−12 erg cm−2 s−1 sr−1 are shown in white for better visibility of the higher intensities. The white rectangle on the first panel delimits the parameter space characterizing the Horsehead Nebula.
or G0, with Pth = 105 K cm−3. The white full line represents the standard deviation of the additive noise, σa,ℓ, from Eq. 15 for the ORION-B observations (Pety et al. 2017). The dashed white line indicates the standard deviation with a ten times longer integration time (deeper integration use case). The regions with integrated intensities lower than 10−12 erg cm−2 s−1 sr−1 are shown in white for better visibility of the higher intensities. The white rectangle on the first panel delimits the parameter space characterizing the Horsehead Nebula.
Current usage metrics show cumulative count of Article Views (full-text article views including HTML views, PDF and ePub downloads, according to the available data) and Abstracts Views on Vision4Press platform.
Data correspond to usage on the plateform after 2015. The current usage metrics is available 48-96 hours after online publication and is updated daily on week days.
Initial download of the metrics may take a while.