Fig. E.1
Download original image
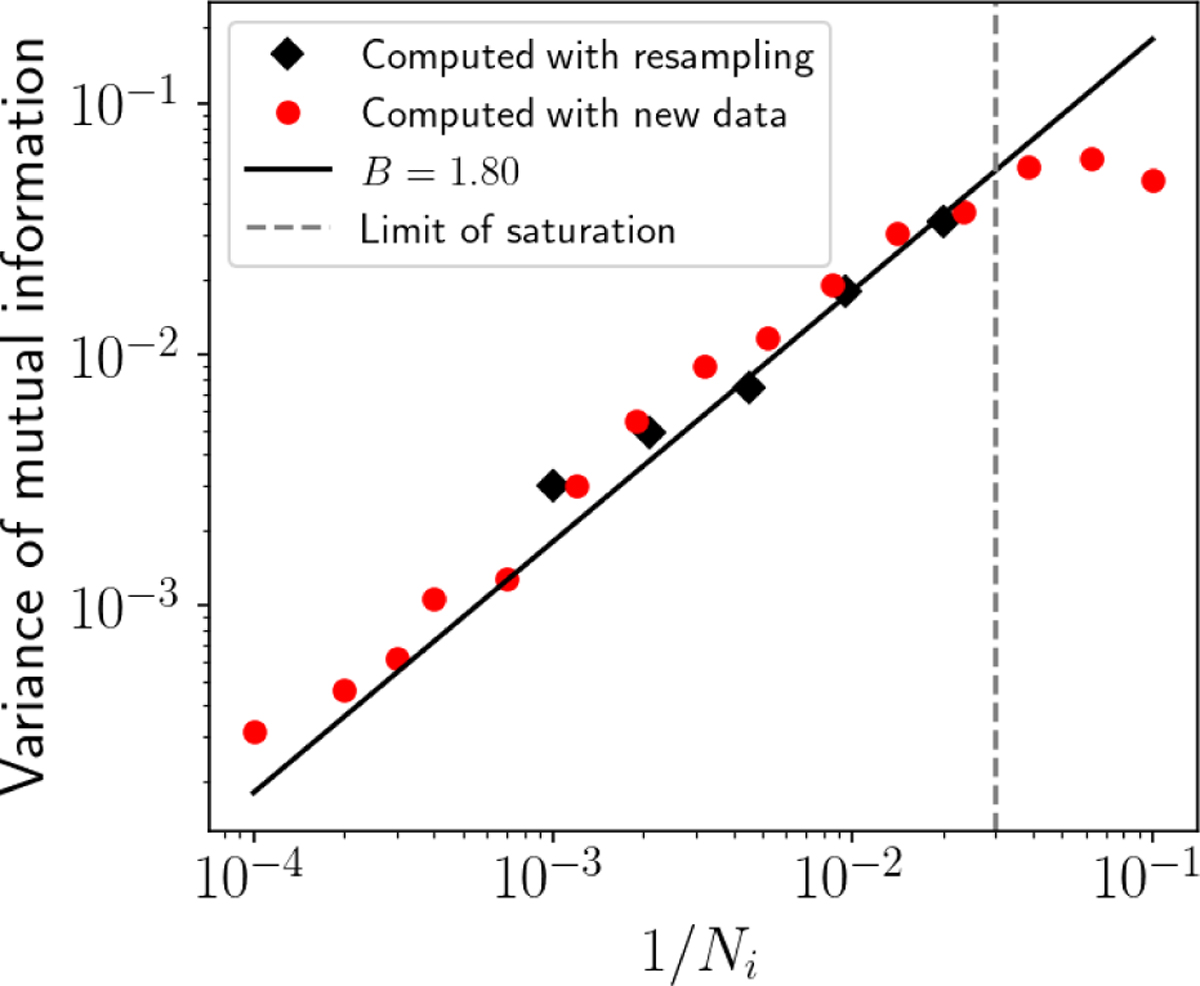
Comparison between the estimation of variances for different numbers of samples for a bivariate normal distribution with ρ = 0.8. Red markers: variances estimated with several different datasets. Black markers: variances estimated with subsampling of a single dataset. Black line: regression line to predict the variance for any number of samples. The limit of saturation indicated by a dashed line corresponds to the number of samples for which the relationship of Eq. E.3 no longer holds.
Current usage metrics show cumulative count of Article Views (full-text article views including HTML views, PDF and ePub downloads, according to the available data) and Abstracts Views on Vision4Press platform.
Data correspond to usage on the plateform after 2015. The current usage metrics is available 48-96 hours after online publication and is updated daily on week days.
Initial download of the metrics may take a while.