Fig. B.1
Download original image
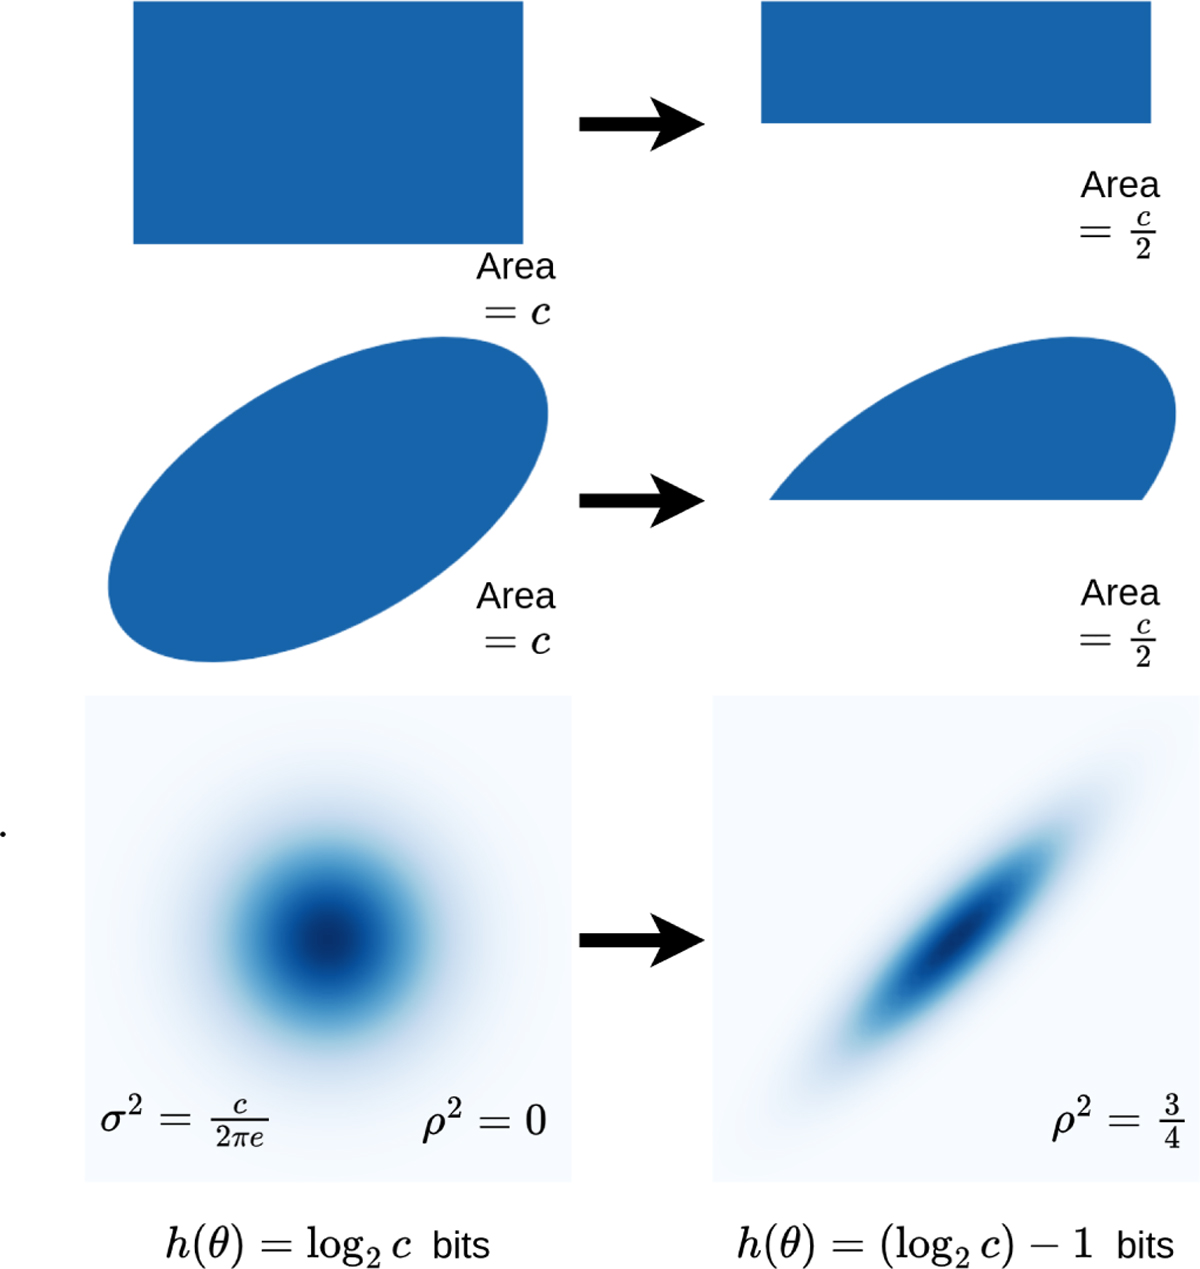
Entropy definition illustration for different example distributions on θ. The first two rows show the PDF of uniform distributions on different sets, and the last row of Gaussian distributions. The distributions in one column have an equal differential entropy h (Θ) whose value depends on a positive constant c. Each arrow indicates a gain of 1 bit of information, i.e., a decrease in the entropy of 1 bit. In the last row, the variance in both horizontal and vertical directions is denoted σ2, and the correlation coefficient ρ.
Current usage metrics show cumulative count of Article Views (full-text article views including HTML views, PDF and ePub downloads, according to the available data) and Abstracts Views on Vision4Press platform.
Data correspond to usage on the plateform after 2015. The current usage metrics is available 48-96 hours after online publication and is updated daily on week days.
Initial download of the metrics may take a while.