Fig. 1
Download original image
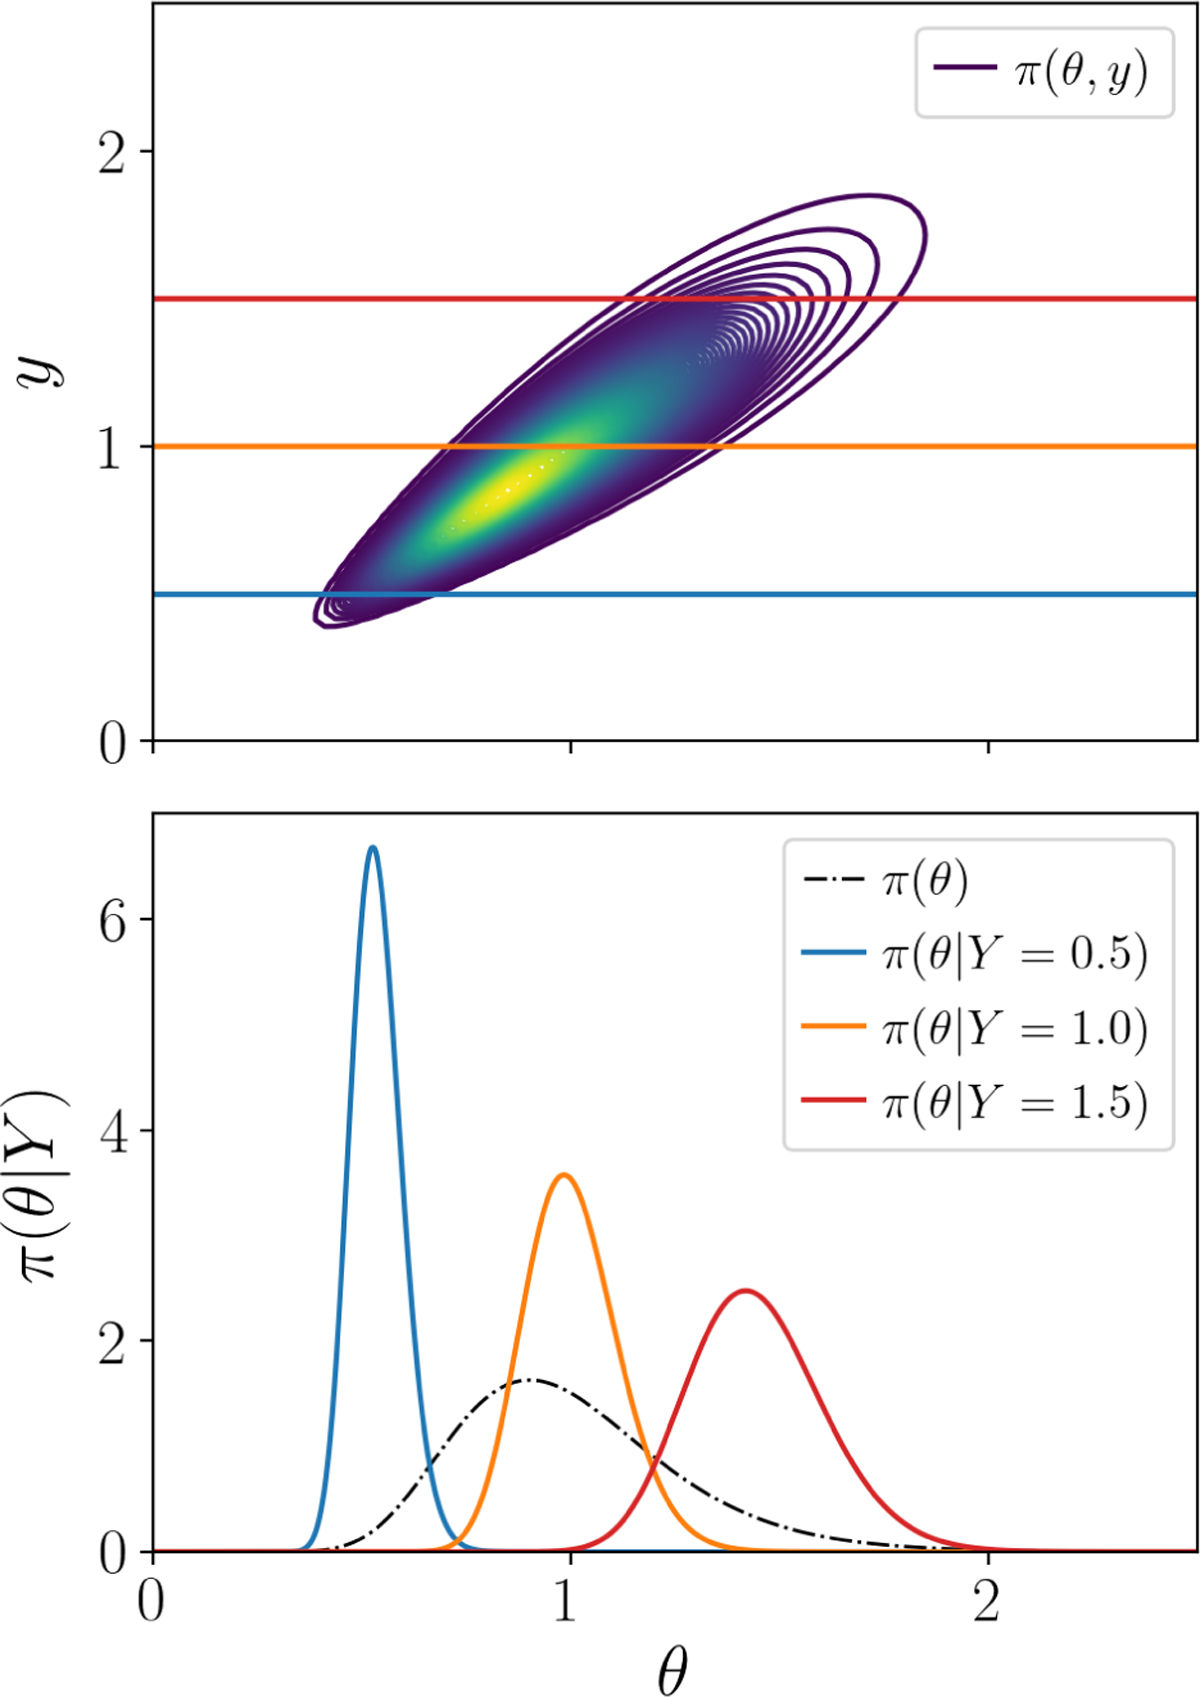
A simple synthetic example of a joint distribution on the couple (Θ, Y). Top: contour levels of the PDF of the joint distribution with lognormal marginals and a clear correlation. Three observed values are indicated with horizontal lines. Bottom: comparison of the distribution on Θ before any observation (prior, in dashed black) and for the three y values (conditional distributions, in colors).
Current usage metrics show cumulative count of Article Views (full-text article views including HTML views, PDF and ePub downloads, according to the available data) and Abstracts Views on Vision4Press platform.
Data correspond to usage on the plateform after 2015. The current usage metrics is available 48-96 hours after online publication and is updated daily on week days.
Initial download of the metrics may take a while.