Open Access
Fig. 5.
Download original image
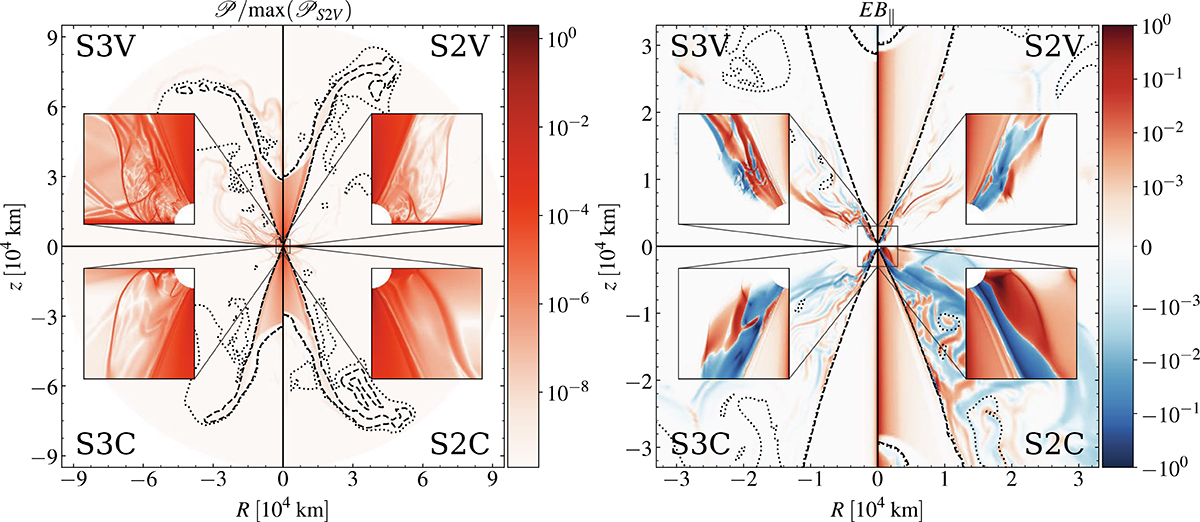
Dissipated power (left panel) and normalized parallel component of the electric magnetic field (right panel) for the different resistivity cases at t ∼ 0.5 s. The zoomed regions show the inner region up to 3000 km in both the R and z directions for both panels.
Current usage metrics show cumulative count of Article Views (full-text article views including HTML views, PDF and ePub downloads, according to the available data) and Abstracts Views on Vision4Press platform.
Data correspond to usage on the plateform after 2015. The current usage metrics is available 48-96 hours after online publication and is updated daily on week days.
Initial download of the metrics may take a while.