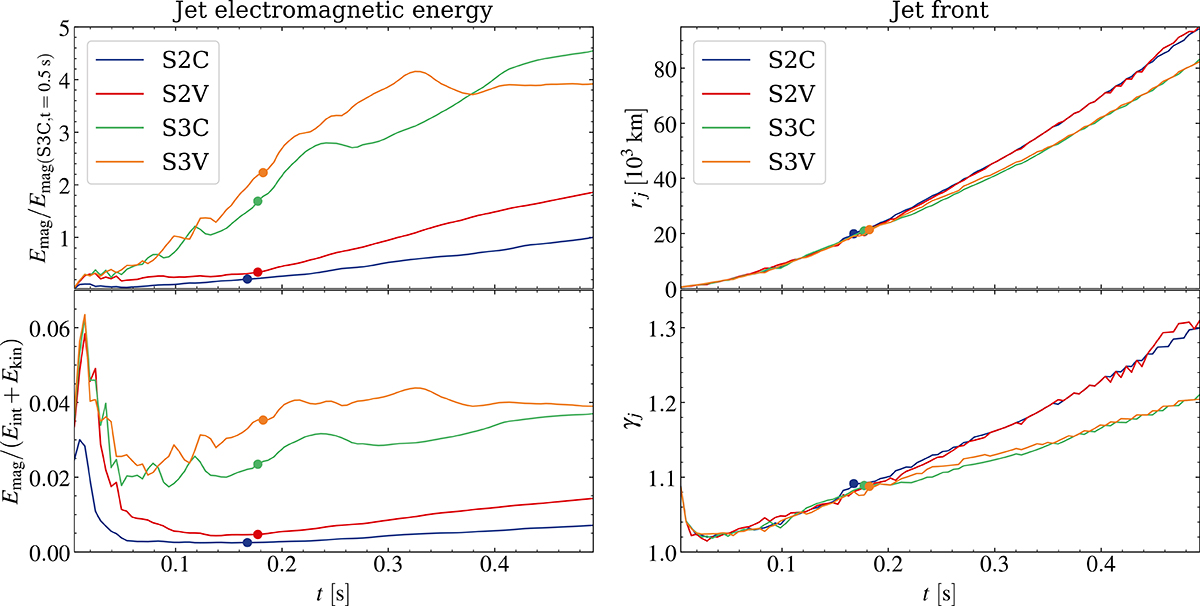
Fig. 4.
Download original image
Time evolution of the jet energetics and dynamics. The electromagnetic energy contribution (compared to that of the case S3C at the final time in the top left panel and to the kinetic + internal energy in the bottom left panel) and the jet front (position in the top panel, and Lorentz factor in the bottom panel) are shown for different 2D runs. The circle dot represents the time of slow breakout.
Current usage metrics show cumulative count of Article Views (full-text article views including HTML views, PDF and ePub downloads, according to the available data) and Abstracts Views on Vision4Press platform.
Data correspond to usage on the plateform after 2015. The current usage metrics is available 48-96 hours after online publication and is updated daily on week days.
Initial download of the metrics may take a while.