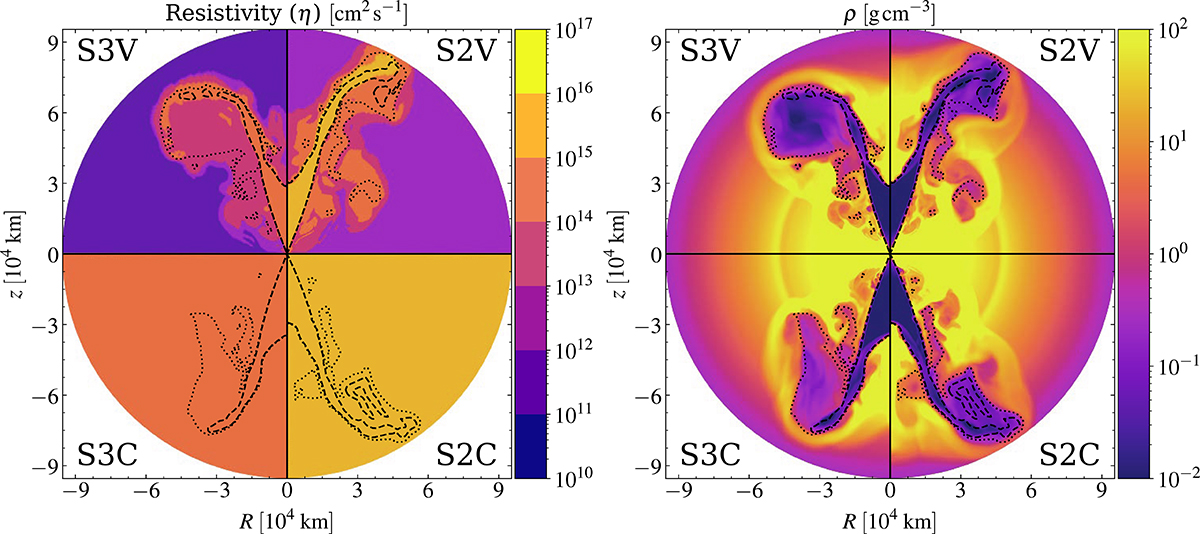
Fig. 2.
Download original image
Resistivity η (left panel) and rest-mass density ρ (right panel) at the final time of the simulation (t ∼ 0.5 s) for the different resistivity cases. The dashed black line represents the tracer contour line at level 1%, while the solid lines are only designed to delimit the different cases. We note that in this and all the 2D plots, the angle θ is between 0° and 90° and the negative cylindrical coordinates are simply a post-processing transformation to enhance the comparison quality.
Current usage metrics show cumulative count of Article Views (full-text article views including HTML views, PDF and ePub downloads, according to the available data) and Abstracts Views on Vision4Press platform.
Data correspond to usage on the plateform after 2015. The current usage metrics is available 48-96 hours after online publication and is updated daily on week days.
Initial download of the metrics may take a while.