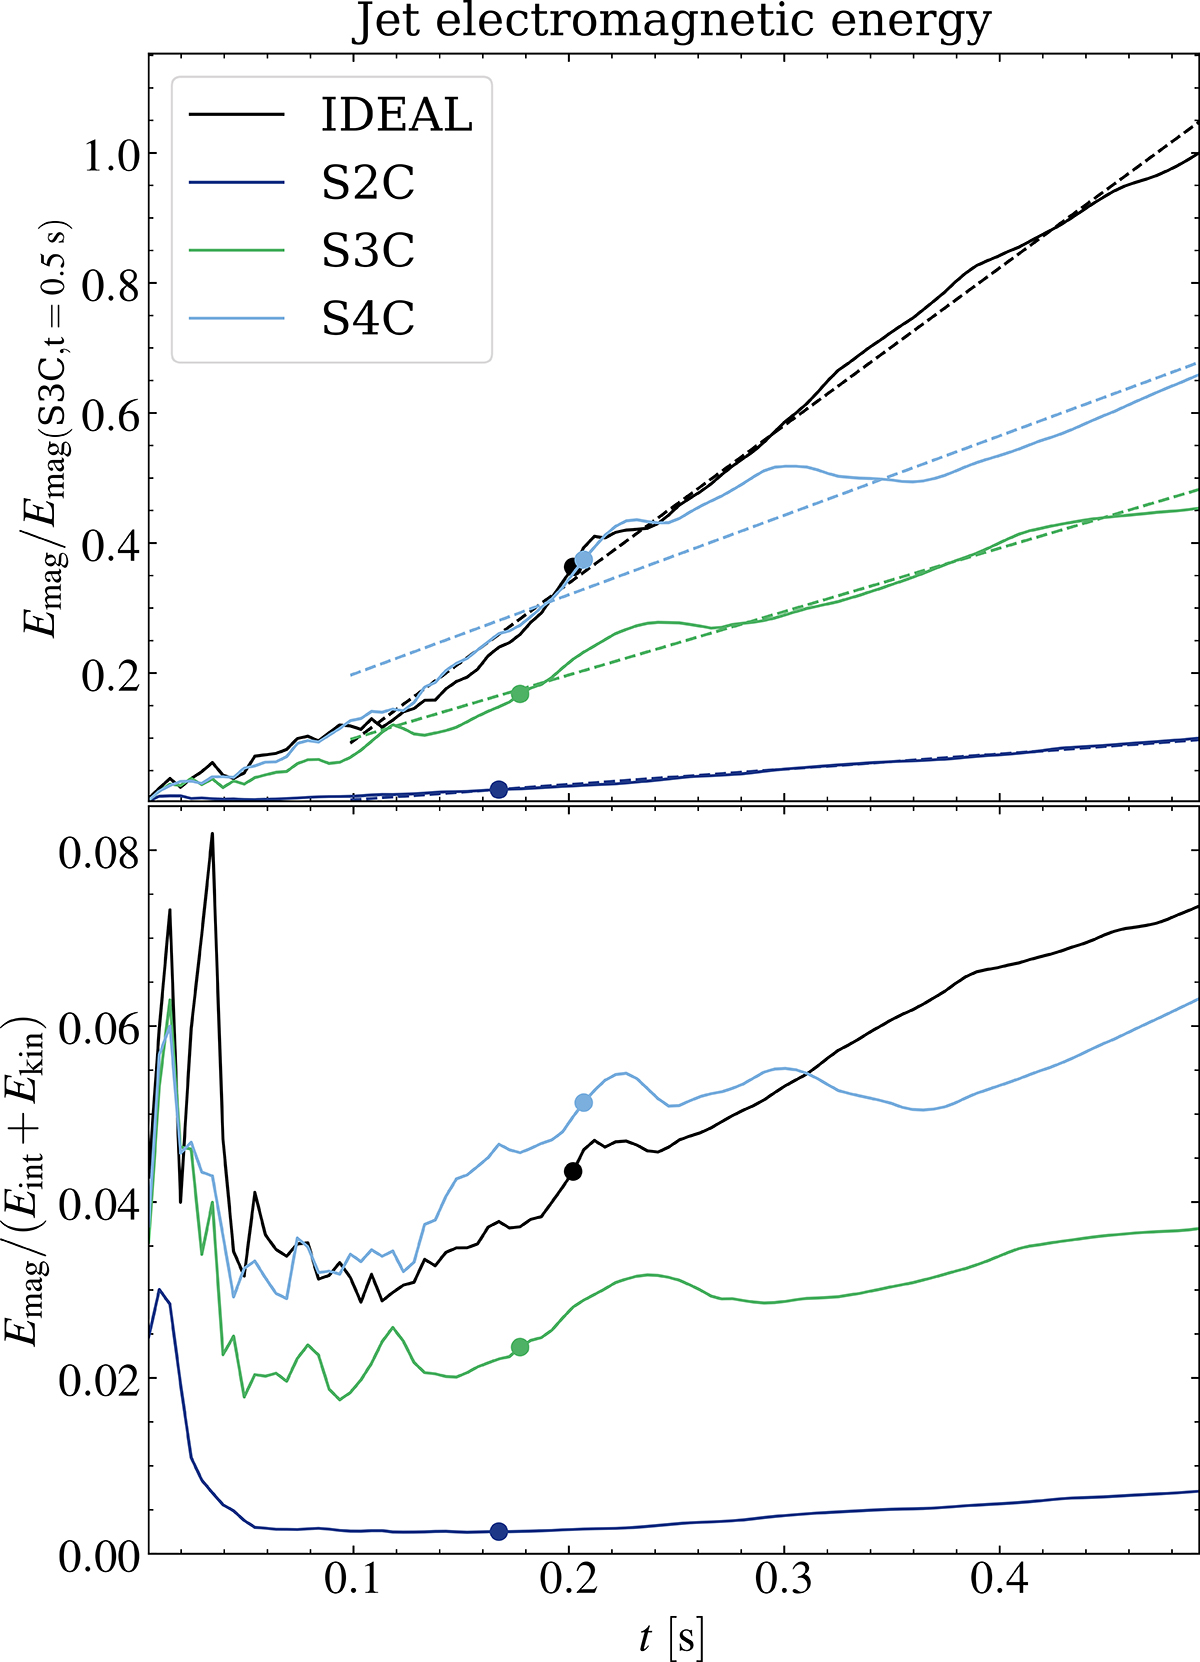
Fig. A.1.
Download original image
Electromagnetic energy contribution (compared to the one of the case S3C at the final time in the top panel and to the kinetic + internal energy in the bottom panel) for different values of the Lundquist number and constant resistivity (colored lines) and ideal run (black line). The dashed lines are the linear approximation of the evolution of electromagnetic energy at later times. The circle dot represents the slow breakout.
Current usage metrics show cumulative count of Article Views (full-text article views including HTML views, PDF and ePub downloads, according to the available data) and Abstracts Views on Vision4Press platform.
Data correspond to usage on the plateform after 2015. The current usage metrics is available 48-96 hours after online publication and is updated daily on week days.
Initial download of the metrics may take a while.