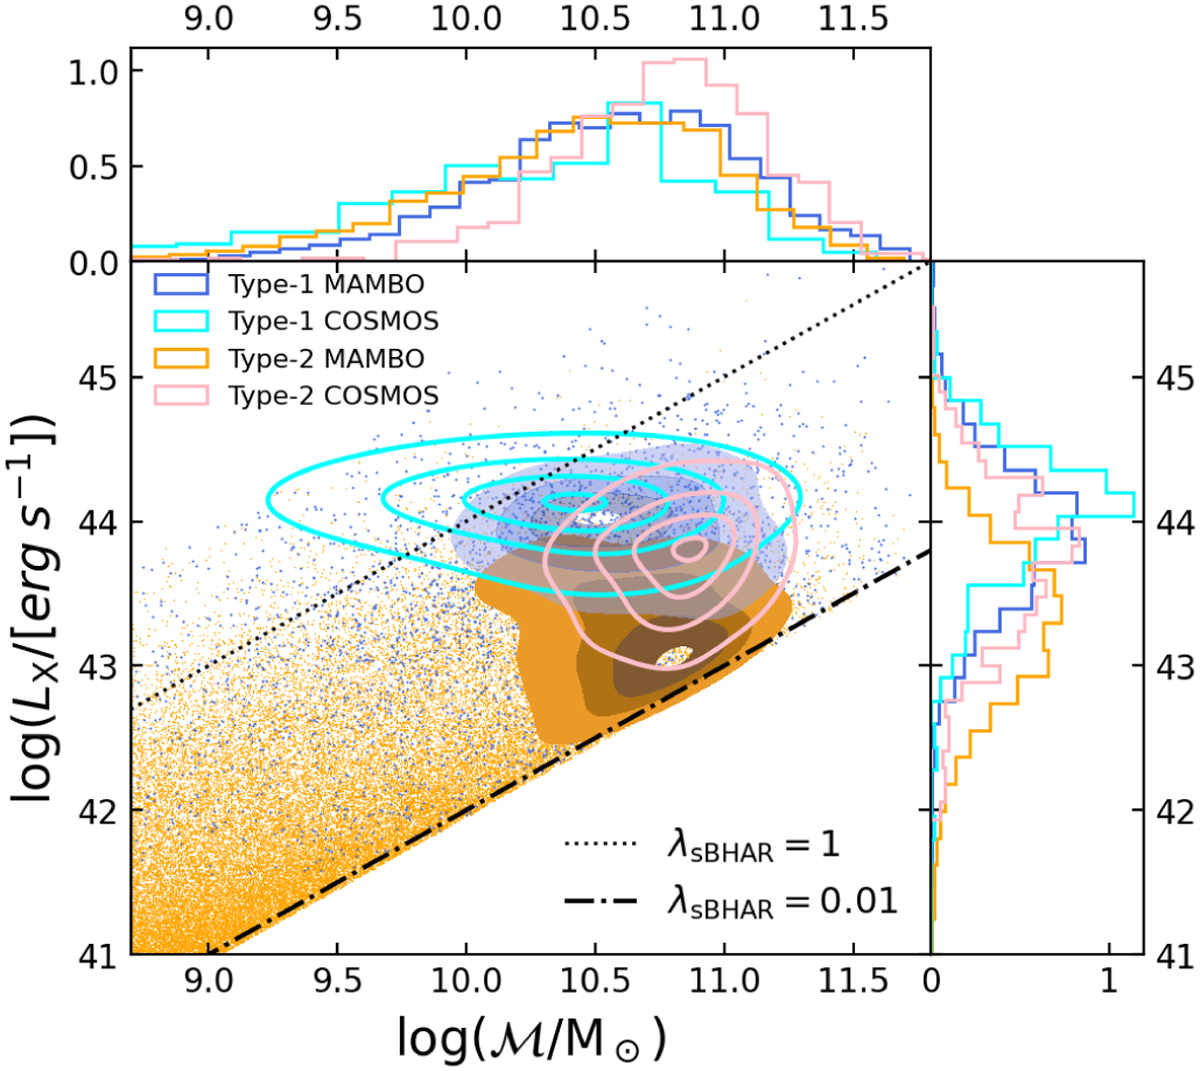
Fig. 7
Download original image
AGN from our lightcone scattered in the LX–ℳ plane, separated into type 1 (blue) and type 2 (orange) AGN. The points in the central panel show the distribution of all the sources, while the solid contours and the histograms from the upper and right panel correspond to sources selected above FX = 1.9 × 10⁻¹⁵ erg s–1 cm–2. We show also the distribution of sources from the Chandra COSMOS Legacy Spectral Survey (Marchesi et al. 2016b), with the same cut in FX, and separated into type 1 (cyan) and type 2 (pink) AGN. The contour levels represen iso-density lines, corresponding to the 50th, 75th, 90th, and 99th percentiles of the distribution. The dash-dotted and dotted black lines mark the locus where λSBHAR = 0.01 and 1, respectively, which assuming a mean bolometric correction of kbol = 25 and a constant mass ratio of black hole to host galaxy of MBH ≈ 0.002ℳ correspond approximately to 1 and 100% of the Eddington limit, respectively.
Current usage metrics show cumulative count of Article Views (full-text article views including HTML views, PDF and ePub downloads, according to the available data) and Abstracts Views on Vision4Press platform.
Data correspond to usage on the plateform after 2015. The current usage metrics is available 48-96 hours after online publication and is updated daily on week days.
Initial download of the metrics may take a while.