Fig. 4
Download original image
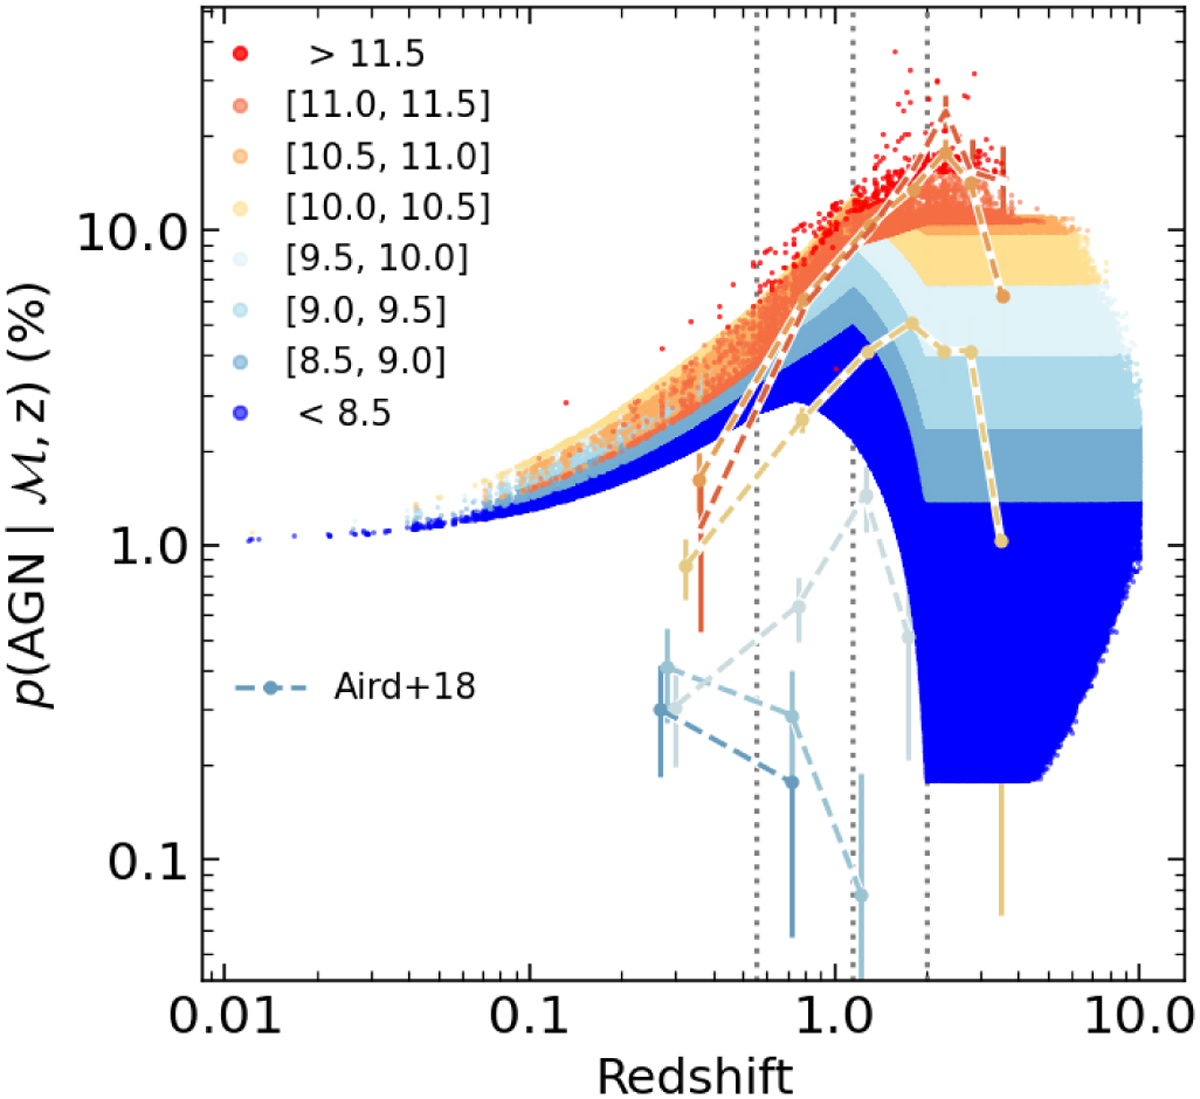
Probability of a galaxy hosting an AGN as a function of redshift. Each point corresponds to a galaxy in the MAMBO lightcone, colour-coded in different ℳ bins indicated in the legend. For comparison, the points with error bars connected by dashed lines show the AGN fraction derived in A18, also in different mass bins. Vertical dotted lines mark the centre of the three redshift bins studied in B16; namely, z = 0.55, 1.15, 2.0.
Current usage metrics show cumulative count of Article Views (full-text article views including HTML views, PDF and ePub downloads, according to the available data) and Abstracts Views on Vision4Press platform.
Data correspond to usage on the plateform after 2015. The current usage metrics is available 48-96 hours after online publication and is updated daily on week days.
Initial download of the metrics may take a while.