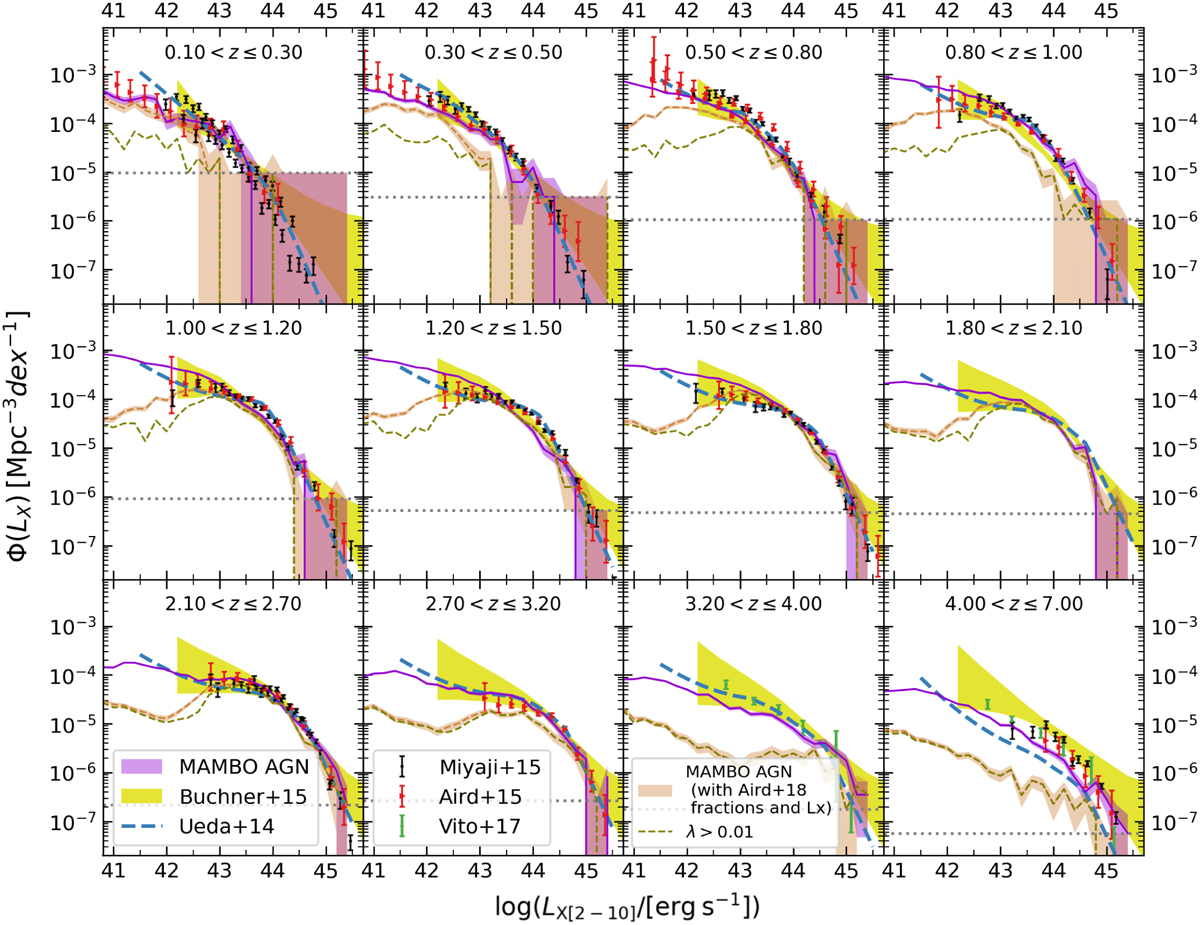
Fig. A.2
Download original image
Hard X-ray luminosity function, using the p (log λsBHAR | ℳ, z) distributions from A18 to infer the AGN fraction and LX distribution at all ℳ and z. The dashed brown line corresponds to all the X-ray emitters, while the dashed green line corresponds to the objects selected with λsBHAR > 0.01. For comparison, the solid purple line shows the XLF from our lightcone using the methodology adopted in this paper, as in Fig. 11. See the caption of Fig. 11 for further details and references to the observed XLFs.
Current usage metrics show cumulative count of Article Views (full-text article views including HTML views, PDF and ePub downloads, according to the available data) and Abstracts Views on Vision4Press platform.
Data correspond to usage on the plateform after 2015. The current usage metrics is available 48-96 hours after online publication and is updated daily on week days.
Initial download of the metrics may take a while.