Fig. 18
Download original image
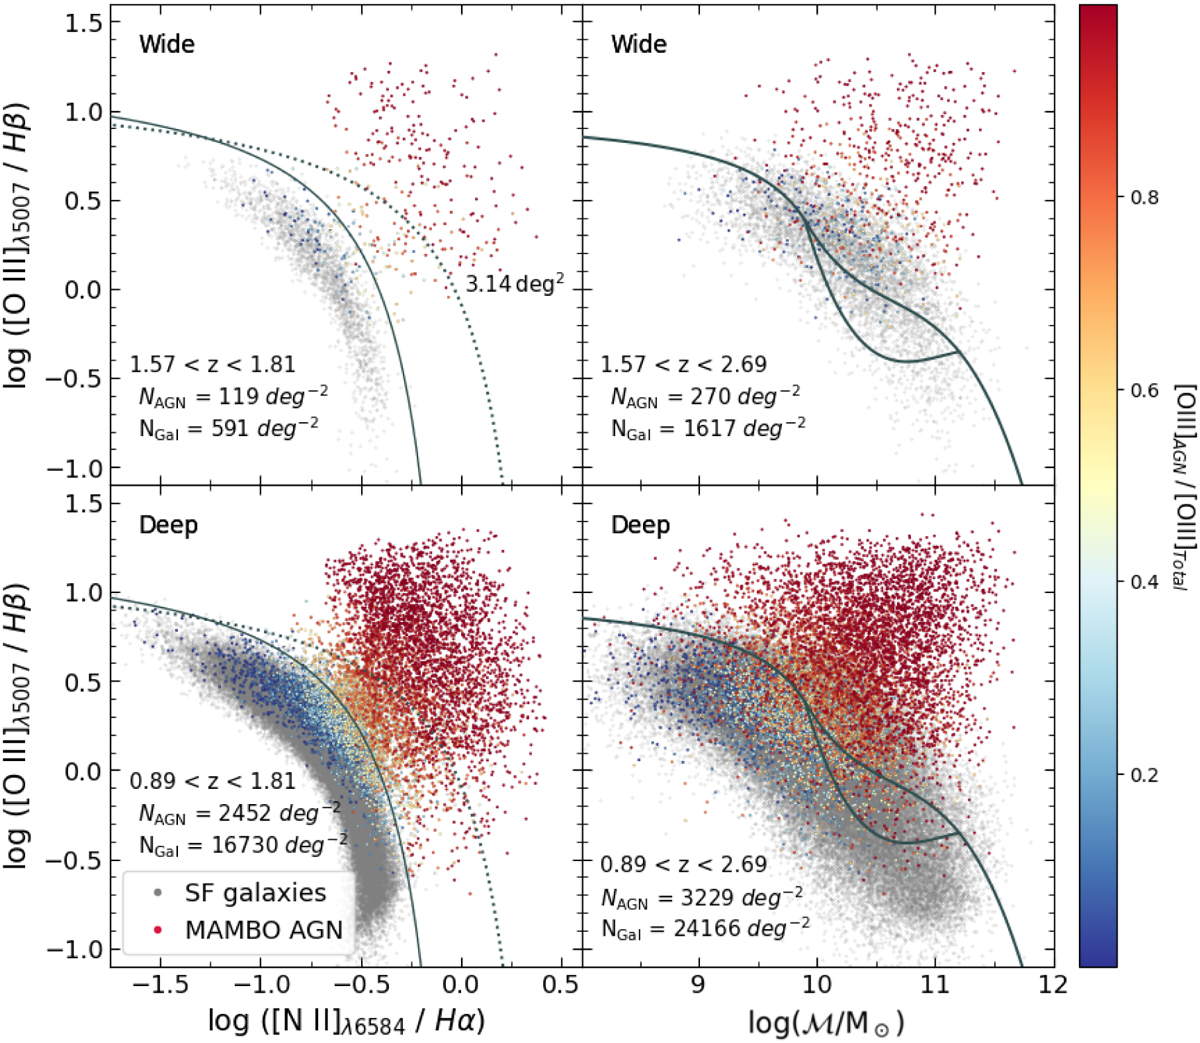
Predictions from our lightcone for the BPT (left panels) and MEx diagrams (right panels) as observed by the Euclid Wide and Deep surveys. For each panel we have plotted the galaxies (grey dots) and AGN (colour-coded from blue to red) corresponding to the specific redshift range, magnitude limit (in H-band) and Hα line flux limit of each survey. The surface density of galaxies and AGN in each diagram are given in the figure. See captions of Figs. 13 and 14 for further details.
Current usage metrics show cumulative count of Article Views (full-text article views including HTML views, PDF and ePub downloads, according to the available data) and Abstracts Views on Vision4Press platform.
Data correspond to usage on the plateform after 2015. The current usage metrics is available 48-96 hours after online publication and is updated daily on week days.
Initial download of the metrics may take a while.