Fig. 16
Download original image
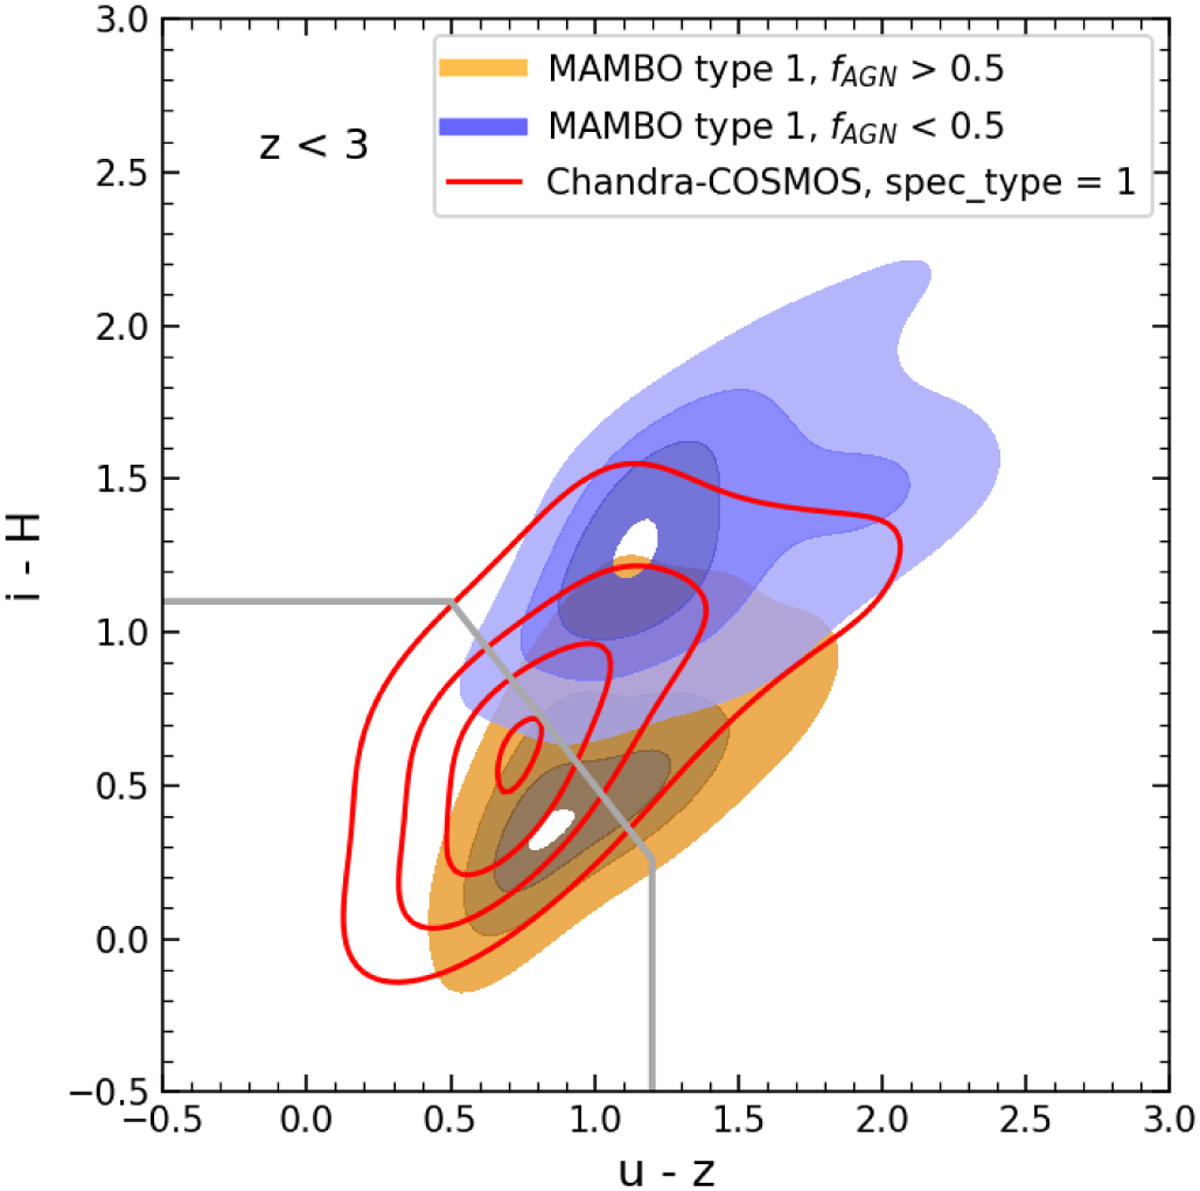
Colour-colour diagram to separate galaxies from type 1 AGN as in Euclid Collaboration (2024a). Filled contours show the distribution of type 1 AGN from the lightcone here presented, separated into those dominated by the AGN component (fAGN > 0.5, orange contours) or the galaxy component (fAGN < 0.5, blue contours). The distribution of spectroscopically confirmed type 1 AGN from the Chandra-COSMOS catalogue Marchesi et al. (2016a) is shown with non-filled red contours. In all cases, the samples have been cut at z < 3. The contour levels represent iso-density lines, corresponding to the 50th, 75th, 90th, and 99th percentiles of the distribution. The grey line shows the best selection criteria found in Euclid Collaboration (2024a) to separate type 1 AGN from galaxies and type 2 AGN.
Current usage metrics show cumulative count of Article Views (full-text article views including HTML views, PDF and ePub downloads, according to the available data) and Abstracts Views on Vision4Press platform.
Data correspond to usage on the plateform after 2015. The current usage metrics is available 48-96 hours after online publication and is updated daily on week days.
Initial download of the metrics may take a while.