Fig. 14
Download original image
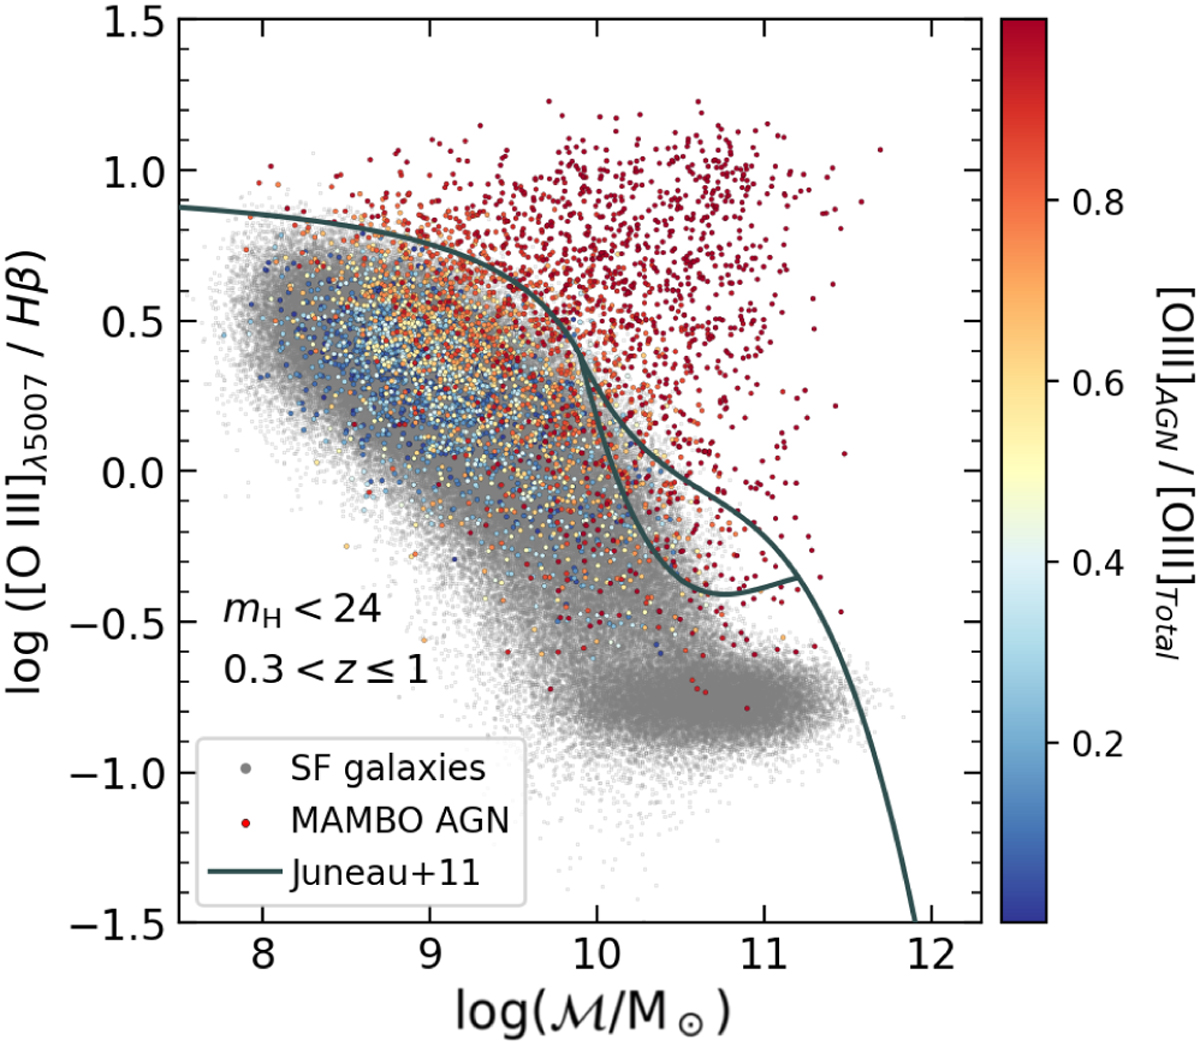
Mass–excitation (MEx) diagram for galaxies and AGN from the MAMBO lightcone selected with 0.3 ≤ z ≤ 1.0 and ![]() . Galaxies are shown in grey, while AGN are colour-coded from blue to red according to the ratio of the emission line flux of [O III] from the AGN component with respect to the total (AGN + host galaxy). The solid black lines show the empirical division found in Juneau et al. (2011) to separate AGN (above the line) from SF galaxies (below the line) and composite galaxies (between the two lines).
. Galaxies are shown in grey, while AGN are colour-coded from blue to red according to the ratio of the emission line flux of [O III] from the AGN component with respect to the total (AGN + host galaxy). The solid black lines show the empirical division found in Juneau et al. (2011) to separate AGN (above the line) from SF galaxies (below the line) and composite galaxies (between the two lines).
Current usage metrics show cumulative count of Article Views (full-text article views including HTML views, PDF and ePub downloads, according to the available data) and Abstracts Views on Vision4Press platform.
Data correspond to usage on the plateform after 2015. The current usage metrics is available 48-96 hours after online publication and is updated daily on week days.
Initial download of the metrics may take a while.