Fig. 13
Download original image
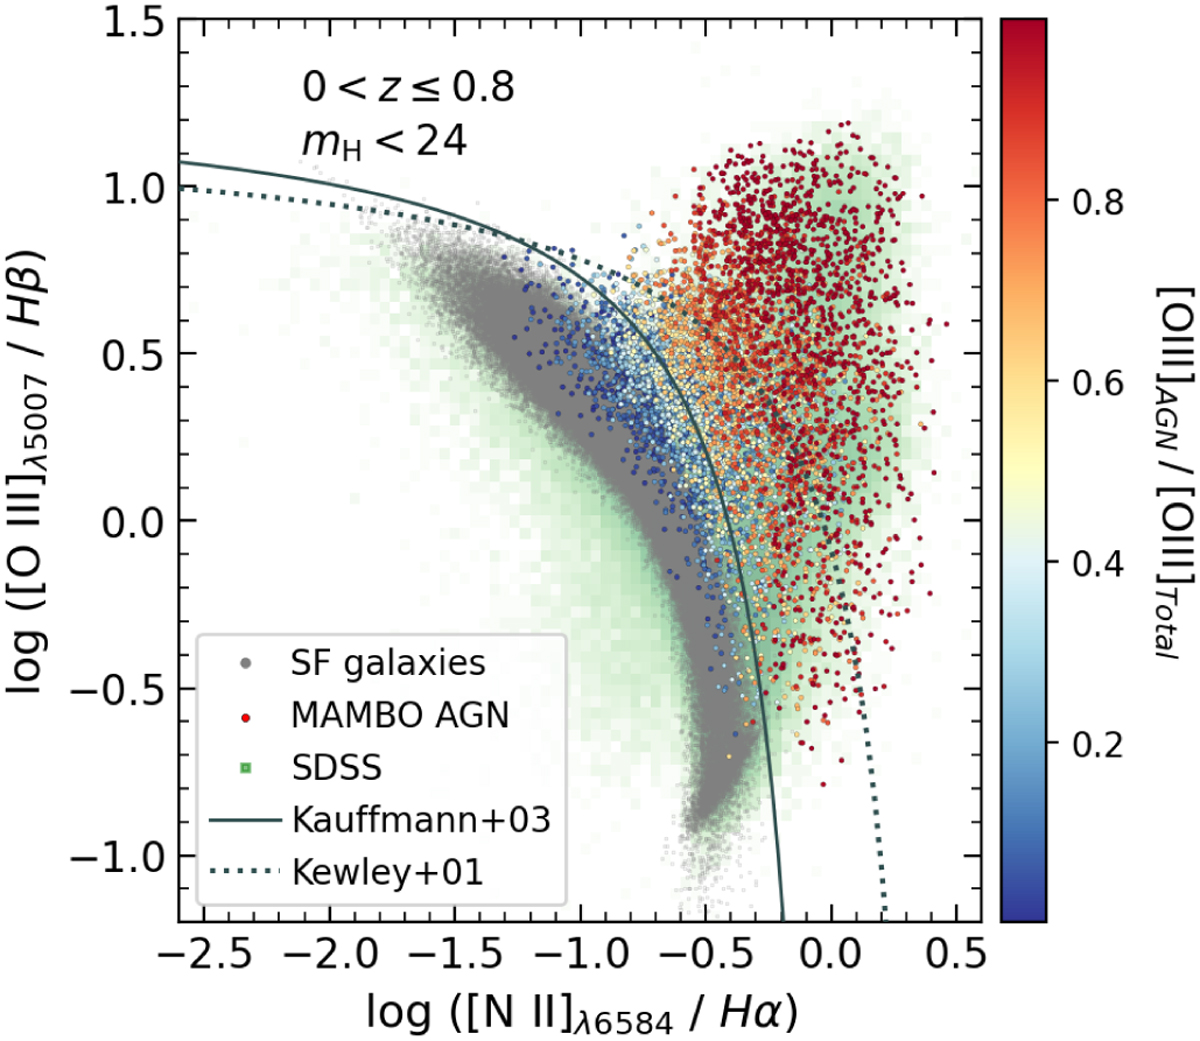
BPT diagram for galaxies and AGN from the MAMBO light-cone selected with z ≤ 0.8 and ![]() . Galaxies are shown in grey, while AGN are colour-coded from blue to red according to the ratio of the emission line flux of [O III] from the AGN component with respect to thetotal(AGN+hostgalaxy). Objects from theSDSSDR8 areshown in green in the background, and are traditionally classified as SF galaxies if the fall at the left of the Kauffmann et al. (2003), as AGN if they fall at the right of the Kewley et al. (2001) line, or as composite if they fall in between these two lines.
. Galaxies are shown in grey, while AGN are colour-coded from blue to red according to the ratio of the emission line flux of [O III] from the AGN component with respect to thetotal(AGN+hostgalaxy). Objects from theSDSSDR8 areshown in green in the background, and are traditionally classified as SF galaxies if the fall at the left of the Kauffmann et al. (2003), as AGN if they fall at the right of the Kewley et al. (2001) line, or as composite if they fall in between these two lines.
Current usage metrics show cumulative count of Article Views (full-text article views including HTML views, PDF and ePub downloads, according to the available data) and Abstracts Views on Vision4Press platform.
Data correspond to usage on the plateform after 2015. The current usage metrics is available 48-96 hours after online publication and is updated daily on week days.
Initial download of the metrics may take a while.