Fig. 11
Download original image
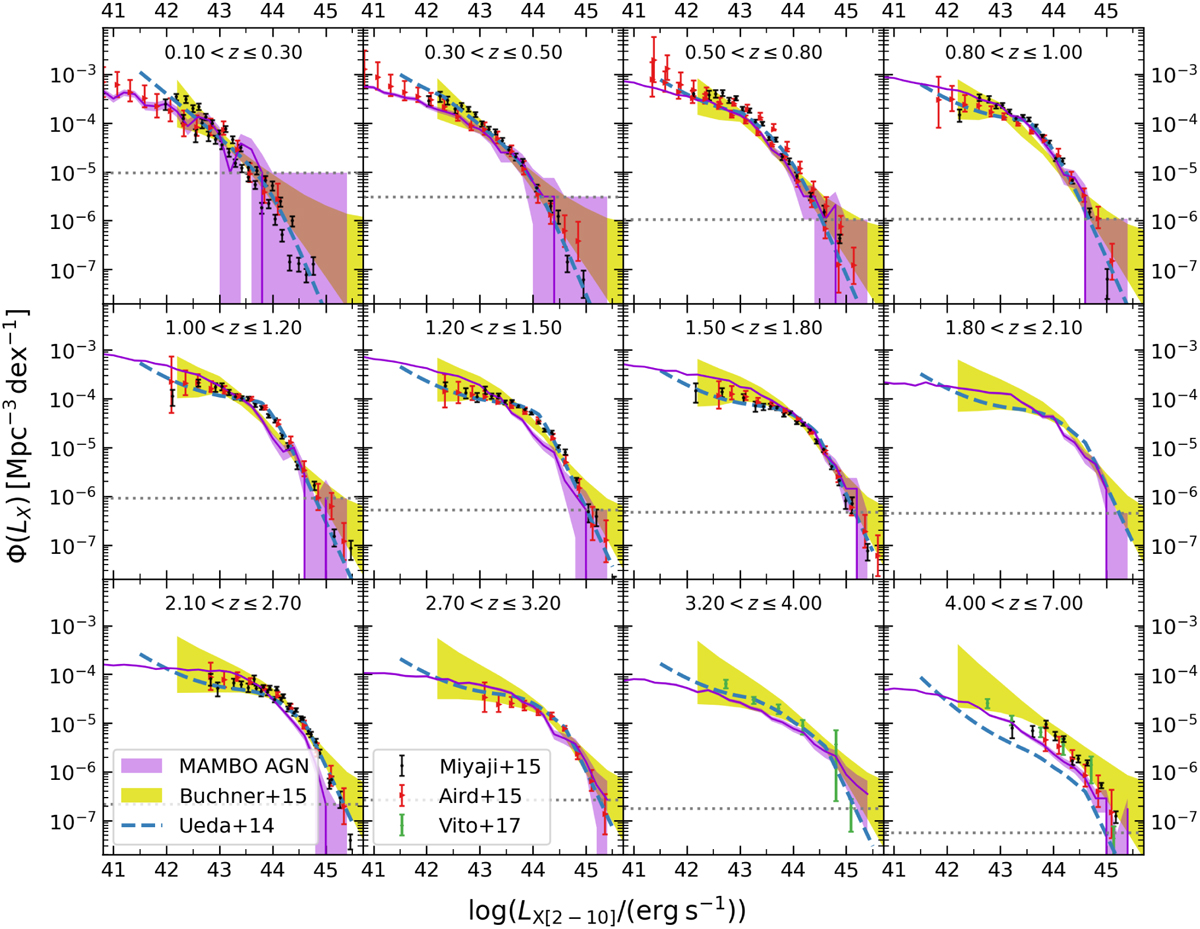
Hard X-ray luminosity function of the total population of AGN of our catalogue in different redshift bins, shown by the pruple line. The shaded region represents the Poissonian uncertainty and the dotted horizontal line marks the limiting density from our lightcone (corresponding to 1 object Mpc−3 dex−1). For comparison, we show several observed XLFs: Ueda et al. (2014), Buchner et al. (2015), Miyaji et al. (2015), Aird et al. (2015) and Vito et al. (2017).
Current usage metrics show cumulative count of Article Views (full-text article views including HTML views, PDF and ePub downloads, according to the available data) and Abstracts Views on Vision4Press platform.
Data correspond to usage on the plateform after 2015. The current usage metrics is available 48-96 hours after online publication and is updated daily on week days.
Initial download of the metrics may take a while.