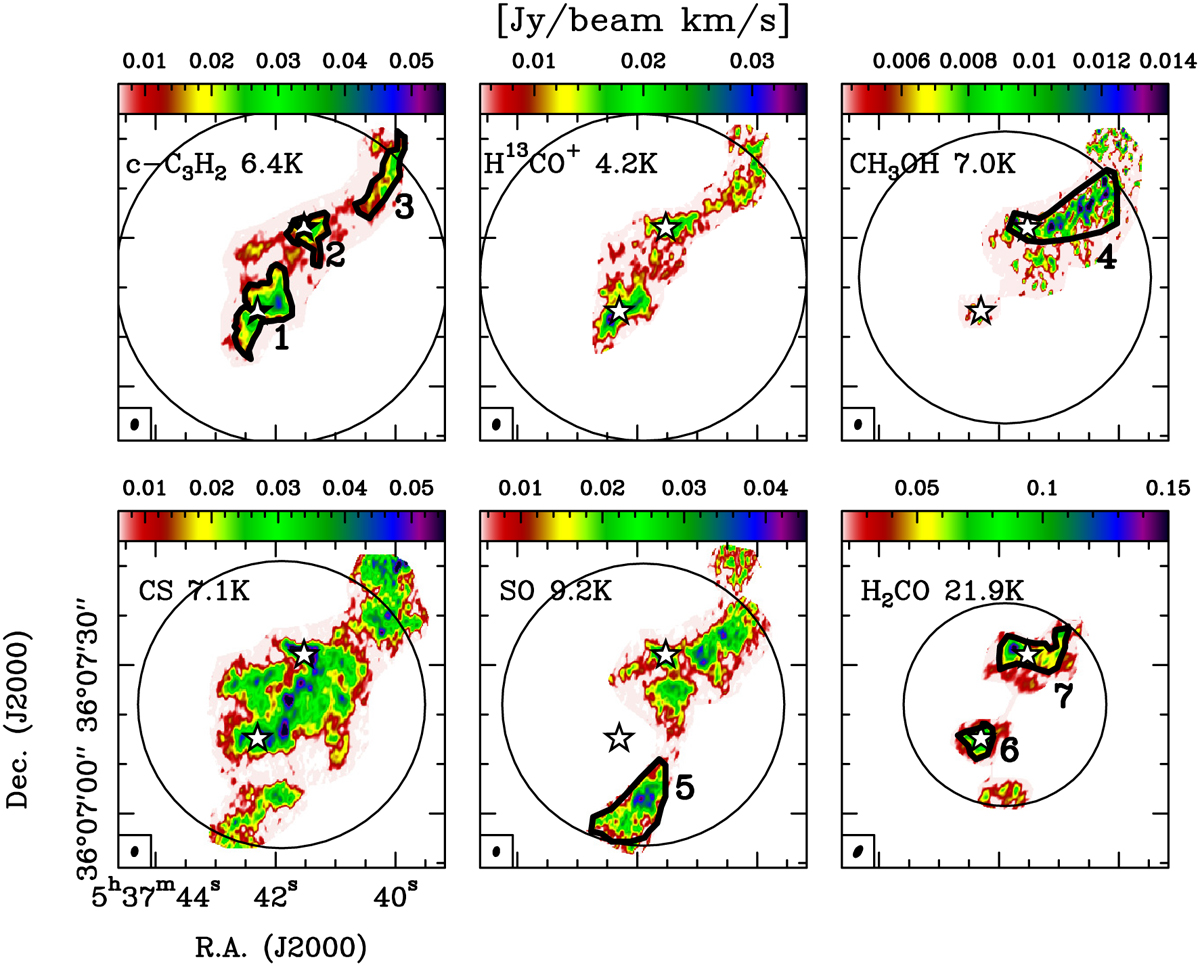
Fig. 4
Download original image
Velocity-integrated molecular emission maps. We show the six molecular species for which the signal-to-noise ratio is good. For C4H, HCS+, HCO, HN13C, and 34SO, the maps are too noisy and we do not show them. The species and the Eup of the line used in temperature units are indicated in the top left corner of each frame. The two stars indicate the peak position of the millimeter-continuum cores N and S. The black circles highlight the primary beam at the rest frequency of each line (Table 2). The integrated emission was computed in the channels in which the intensity was higher than the 3σ rms level. The velocity intervals used are [−18.4;−16.5] km s−1 for c-C3H2; [−19;−16] km s−1 for H13CO+; [−18.75;−16;25] km s−1 for CH3OH (from the line centred at ~96.7414 GHz) at [−20;−14] km s−1 for CS; [−19.5;−15.5] km s−1 for SO; [−18.8;−16.2] km s−1 for H2CO (from the line centred at ~140.8395 GHz). The seven regions highlighted in black are those analysed in detail in Sect. 3.4, and they generally correspond to the 5σ rms emission contour of the corresponding integrated-intensity map (within the ALMA primary beam).
Current usage metrics show cumulative count of Article Views (full-text article views including HTML views, PDF and ePub downloads, according to the available data) and Abstracts Views on Vision4Press platform.
Data correspond to usage on the plateform after 2015. The current usage metrics is available 48-96 hours after online publication and is updated daily on week days.
Initial download of the metrics may take a while.