Fig. 5.
Download original image
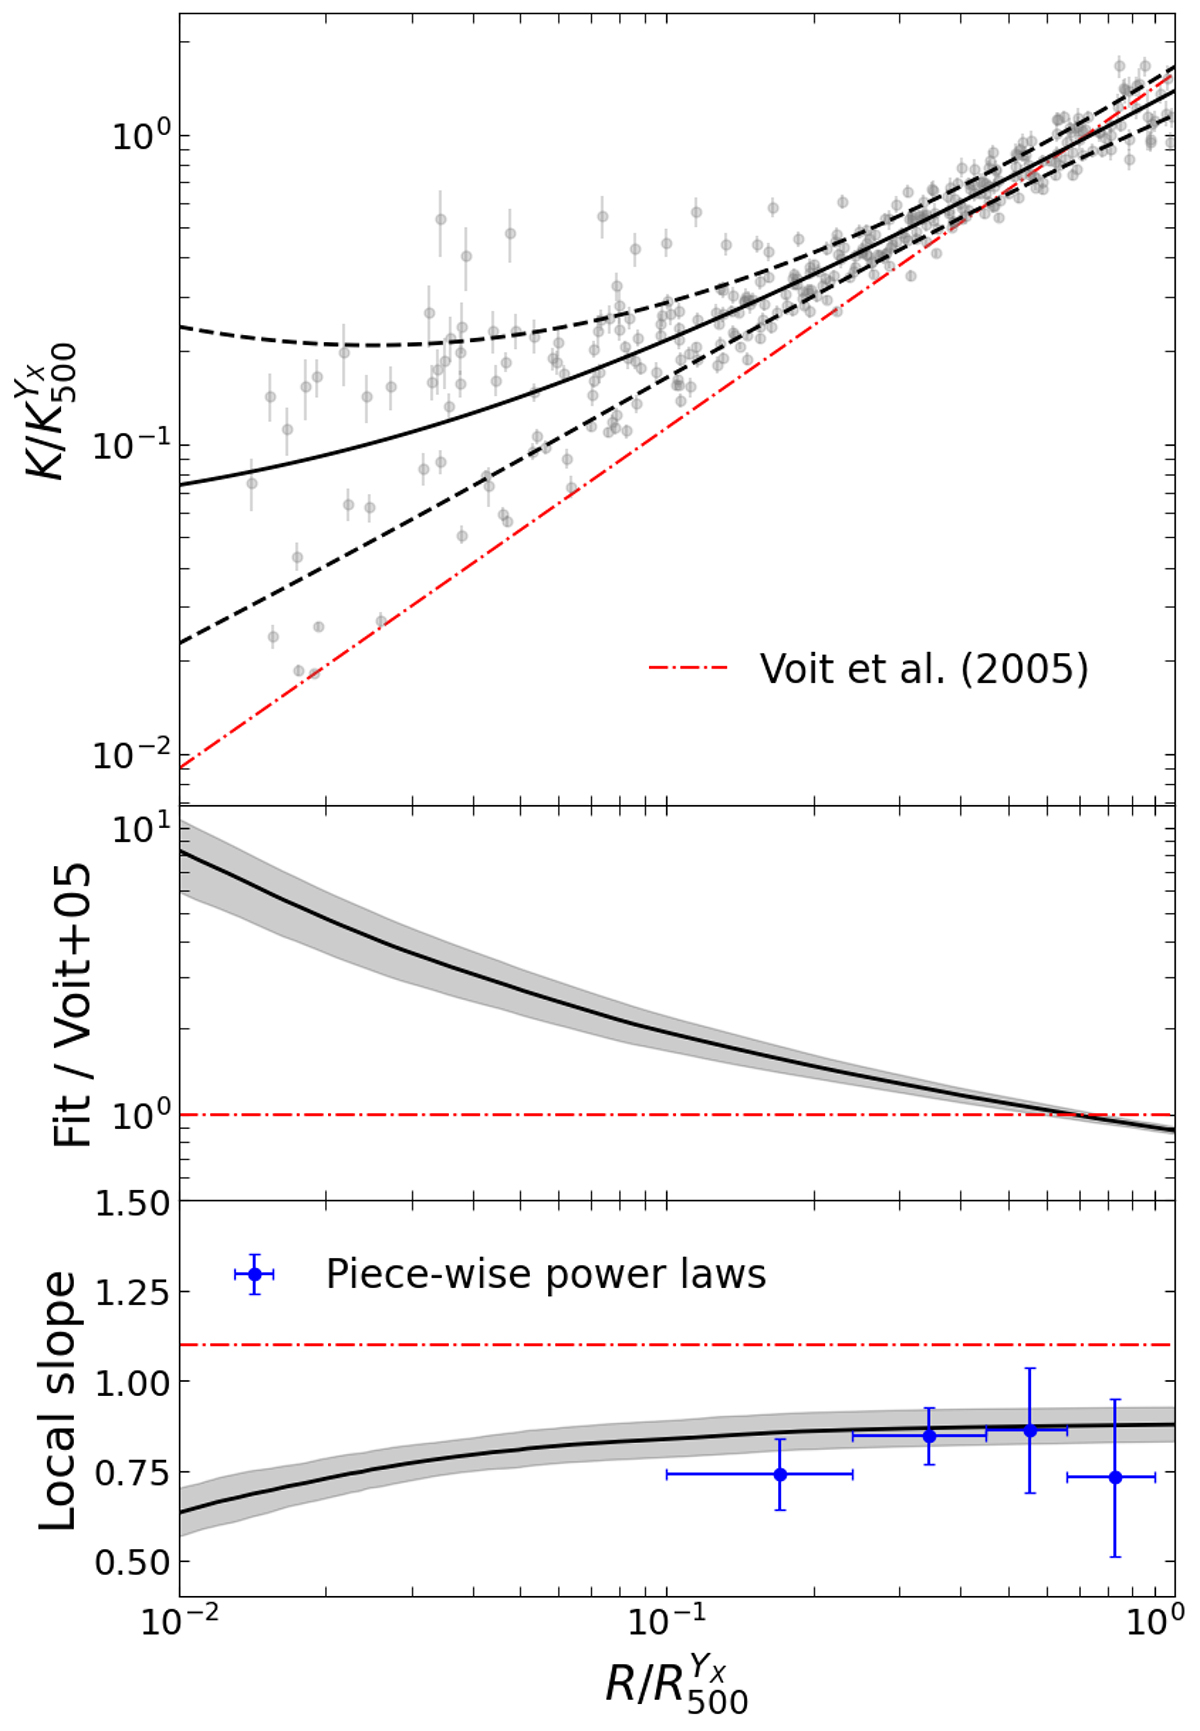
Joint fit of the HIGHMz entropy profiles using the constant-plus-power-law parameterisation (Eqs. (4) and (5)). Top panel: best-fitting model (black), super-imposed to observational measurements (grey dots). Black dashed lines mark the intrinsic scatter, while red dash-dotted line is the prediction from non-radiative simulations (Voit et al. 2005). Central panel: ratio between our best-fitting model and predictions from non-radiative simulations. Grey shaded area is the associated statistical error. Bottom panel: local slope of the best-fitting analytical model (black), together with the associated statistical error (grey). In blue are the slopes obtained using fitting with piece-wise power laws (Eq. (6)). Red dash-dotted line is the canonical 1.1 slope.
Current usage metrics show cumulative count of Article Views (full-text article views including HTML views, PDF and ePub downloads, according to the available data) and Abstracts Views on Vision4Press platform.
Data correspond to usage on the plateform after 2015. The current usage metrics is available 48-96 hours after online publication and is updated daily on week days.
Initial download of the metrics may take a while.