Fig. 2.
Download original image
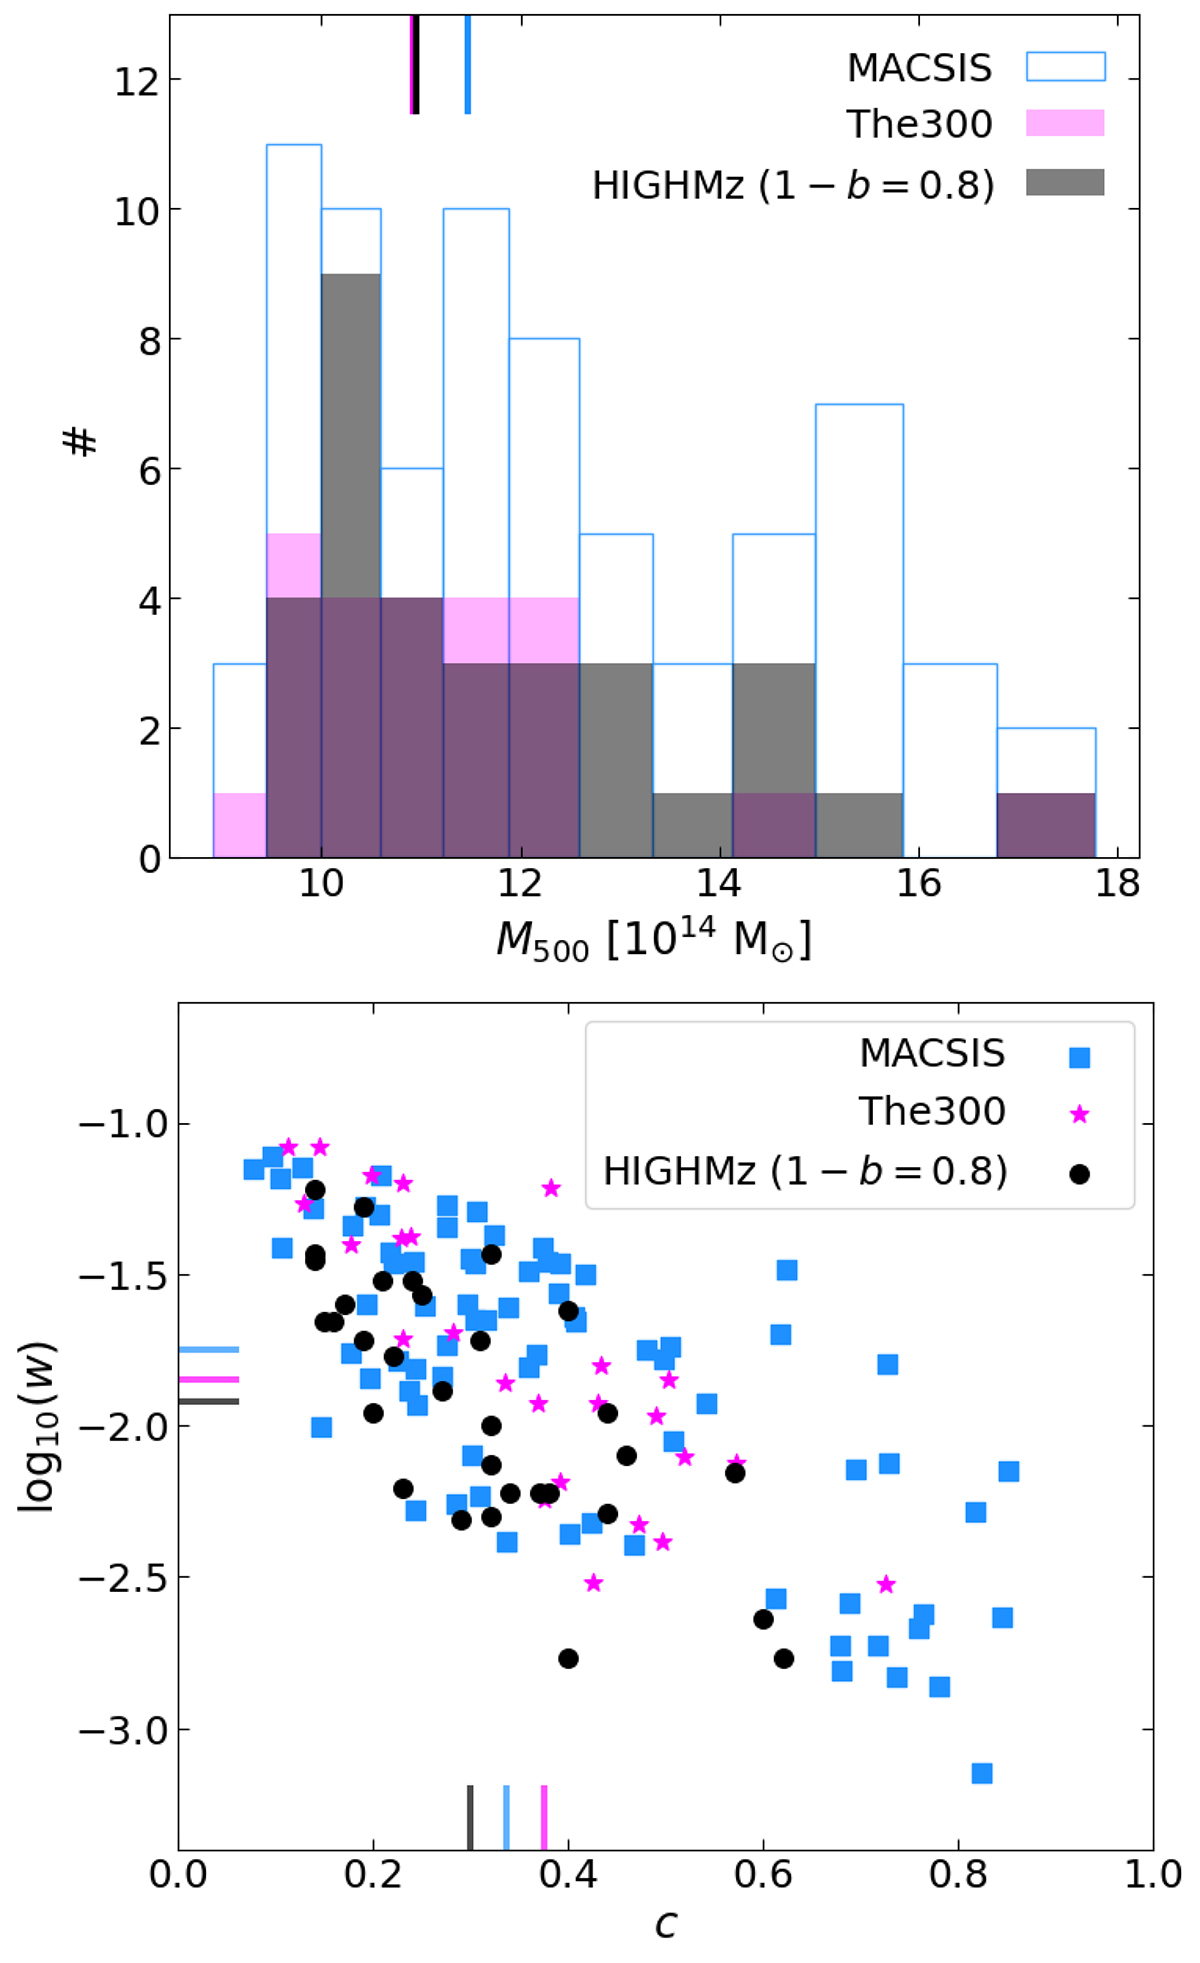
Properties of MACSIS (light blue) and The300 (violet) clusters, in comparison to HIGHMz (black). Top panel: distribution of the cluster masses. Bottom panel: distribution in the concentration-centroid shift plane. In both panels, coloured lines show the median value of the corresponding axis for the three samples. MACSIS and The300 clusters are all at redshifts z = 0.34 and z = 0.333, respectively.
Current usage metrics show cumulative count of Article Views (full-text article views including HTML views, PDF and ePub downloads, according to the available data) and Abstracts Views on Vision4Press platform.
Data correspond to usage on the plateform after 2015. The current usage metrics is available 48-96 hours after online publication and is updated daily on week days.
Initial download of the metrics may take a while.